Hi trader,
Have you ever wondered what's really happening inside a candlestick? Even when candles share the same OHLC values, the price movements within them can still vary significantly.
That’s why we are excited to introduce: TickData Microscope.
This indicator allows you to break down the price movement trajectories inside each candle—whether it's by the tick, second, minute, range or volume.
Instead of just seeing where a candle started and ended, you’ll get 3 distinct plots in the sub-panel representing the movements of the High, Low, and Close prices of each candle.
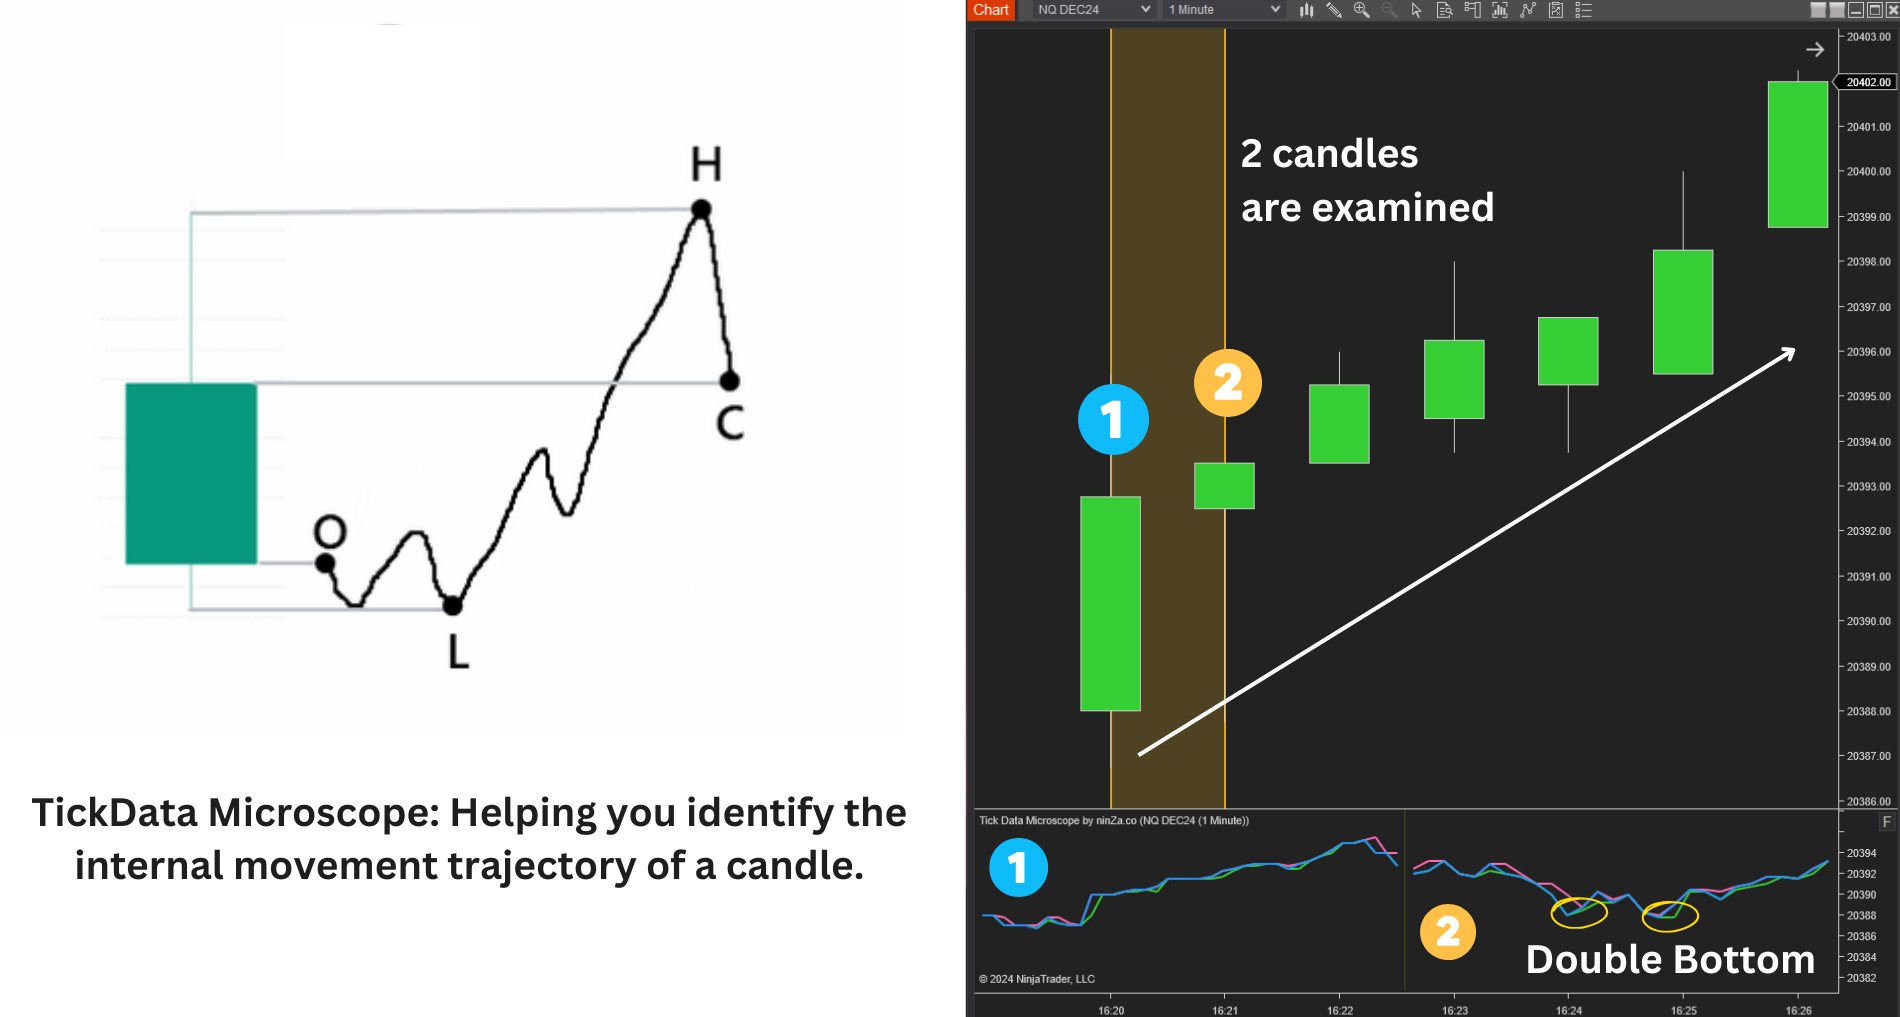
The right chart displays a double-bottom pattern within the candle’s price action, suggesting a likelihood of the price continuing to rise.
This kind of detailed insight can help you assess whether a candle’s signal is truly reliable. This example is just one of many ways you can incorporate the indicator into your analysis.
If you think TickData Microscope could enhance your trading approach, visit its product page for more details: 👉 https://ninza.co/product/tickdata-microscope
