Imbalance Profile Lidar and Imbalance Volume Sensor are designed to identify market imbalances. However, each searches for different types of imbalance - one based on price action, and the other on order flow.
This comparison aims to clarify how these indicators work, their key features, and when to use each, helping traders make informed decisions based on their specific needs.
What Are These Indicators?
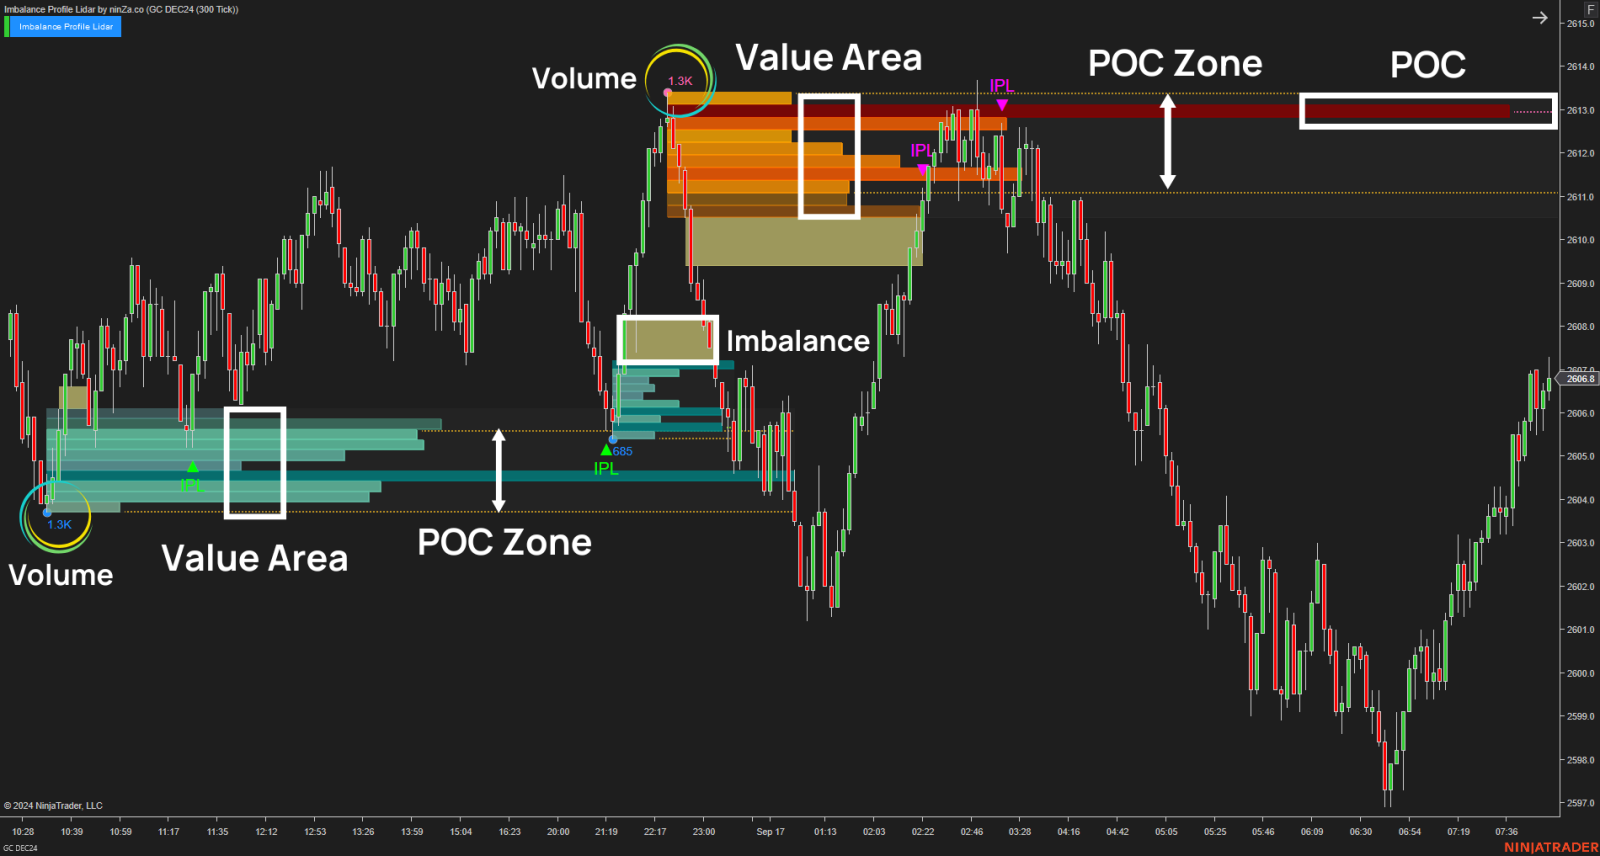
Imbalance Profile Lidar
Focuses on value area (VA) based on price action by combining imbalance phases with volume profiles.
Works only on time-based charts (NOT Range or Renko charts).
Automatically identifies value areas (VA) and Point of Control (POC) around imbalance zones where buying or selling pressure dominates.
Provides signals within these zones to indicate potential entry points and reversals.
Ideal for traders looking to find important support/resistance levels and especially to capture volume at each price tick within those S/R zones.
Imbalance Volume Sensor
Focuses on order flow and volume imbalance tick-by-tick, especially on Renko charts to reduce price noise.
Reliably identifies absolute imbalance zones—areas with a complete absence of buyers or sellers.
Detects high probability pullback and reversal candles by using order flow data and volume delta.
Issues alerts about trend slowdowns and offers market trend charts for better context.
Great for traders using order flow and volume delta to pinpoint precise buy/sell imbalances and refine entry timing.

Key Differences at a Glance
| Feature / Aspect | Imbalance Profile Lidar | Imbalance Volume Sensor |
|---|
| Chart Type | Time-based (1m, 5m, daily) | Primarily Renko |
| Main Focus | Volume profile zones, VA, POC | Order flow, volume delta, absolute imbalance |
| Volume Analysis | Aggregated volume by price ranges | Volume imbalance & order flow at tick level |
| Imbalance Detection | Imbalance phases on consecutive bars | Absence of buyers or sellers on tick marks |
| Key Signals | IPL (primary), imbalance fill, breakout signals | Pullback signals, volume delta, trend alerts |
| Use Cases | Support/resistance at volume zones | Timing entries based on order flow |
| Interface / Output | Highlights volume & value areas | Full trend, zone, signals; composite vs absolute imbalances |
| Trading Style | Day & swing traders | Order flow & trend-following traders |
How They Work: Simple Explanation
Imbalance Profile Lidar Workflow
Detects consecutive bullish/bearish bars indicating strong buying or selling phases.
Identifies supply-demand imbalance during these phases.
Finds nearest pivot points.
Draws value areas (VA) from swing points to imbalance zones.
Calculates POC (price level with highest volume within range).
Generates signals: main IPL, imbalance fill (secondary), or breakout (secondary).
Imbalance Volume Sensor Workflow
Analyzes volume at each price tick to identify zones with no buyers or no sellers (absolute imbalance).
Groups similar candles to form larger composite imbalance zones.
Detects pullbacks and reversal candles within these zones for trade signals.

- Additionally, Volume Delta is used as an extra confirmation:
- A red candle with positive volume indicates a potential sell.
- A green candle with negative volume suggests a buy.

- Provides alerts for slowing trends and visualizes trend charts for quick market overview.
Final Thoughts
Through this review, we believe you now have a clearer picture of which product fits your needs best. We hope this helps you understand each product in detail.
If you're interested in exploring these two products further, check out:
💎 Imbalance Profile Lidar: https://ninza.co/product/imbalance-profile-lidar?src=hellowin
💎 Imbalance Volume Sensor: https://renkokings.com/product/imbalance-volume-sensor?src=hellowin
P.S: Use code "IMBALANCE" to get 52% OFF each product.
