In trend-following trading, identifying a reliable pullback entry point is essential for aligning with the market direction and reducing risk. However, not all pullbacks are created equal. Some are shallow and lack momentum, while others signal strong continuation potential.
This is where the indicators Sumo Pullback$ and Noble Cloud come in. While each functions independently, combining them can offer better clarity when evaluating potential pullback setups within an existing trend.
1. Sumo Pullback$ – Spotting High-Momentum Pullbacks
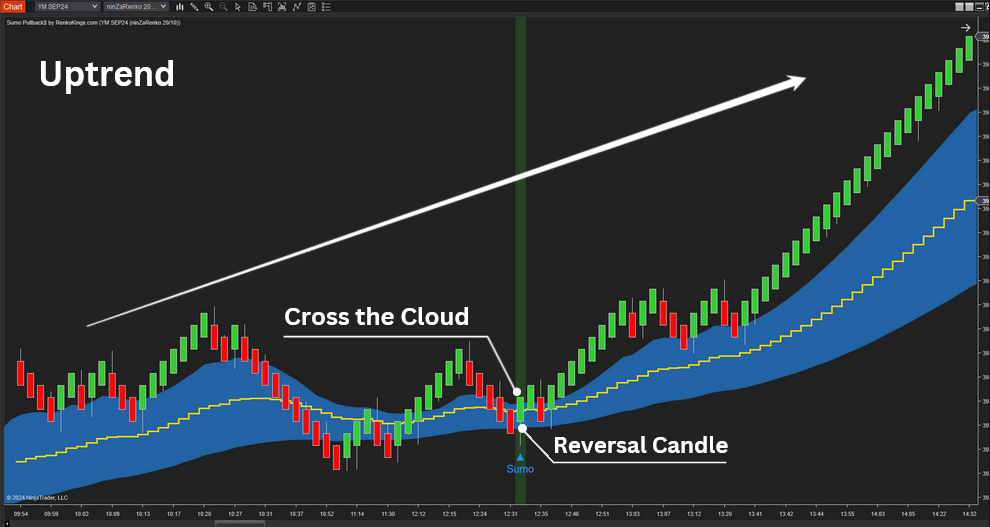
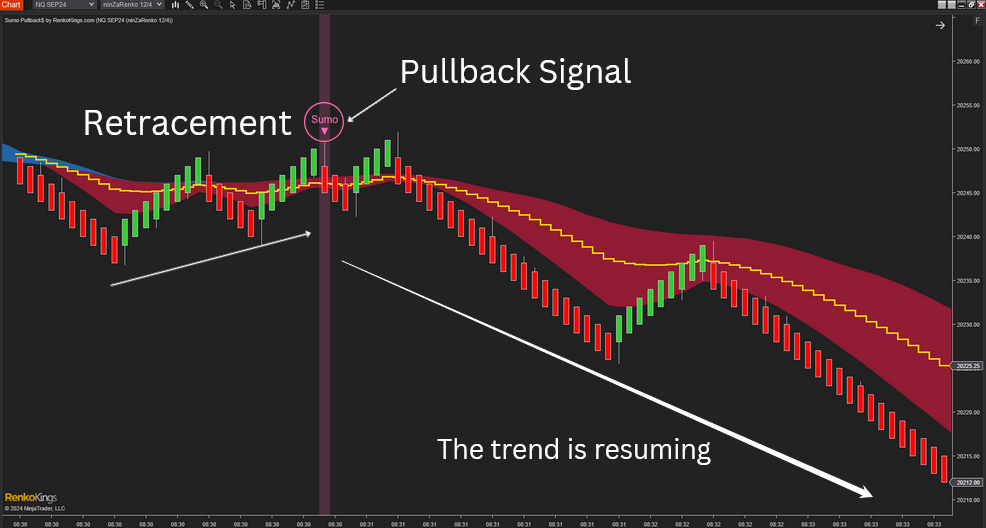
Sumo Pullback$ is an indicator that incorporates:
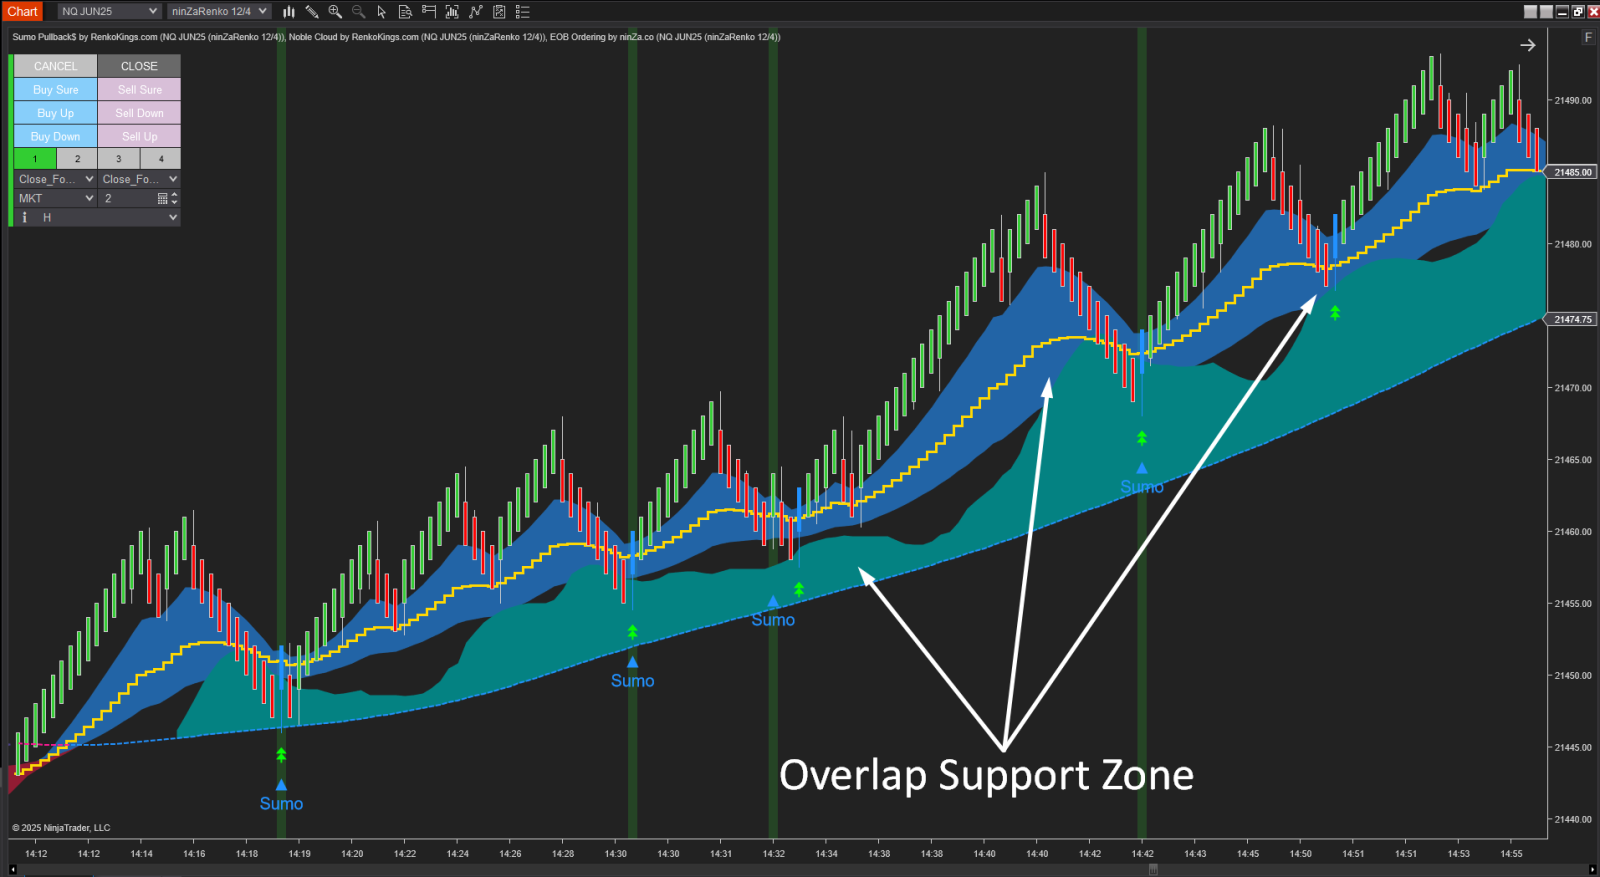
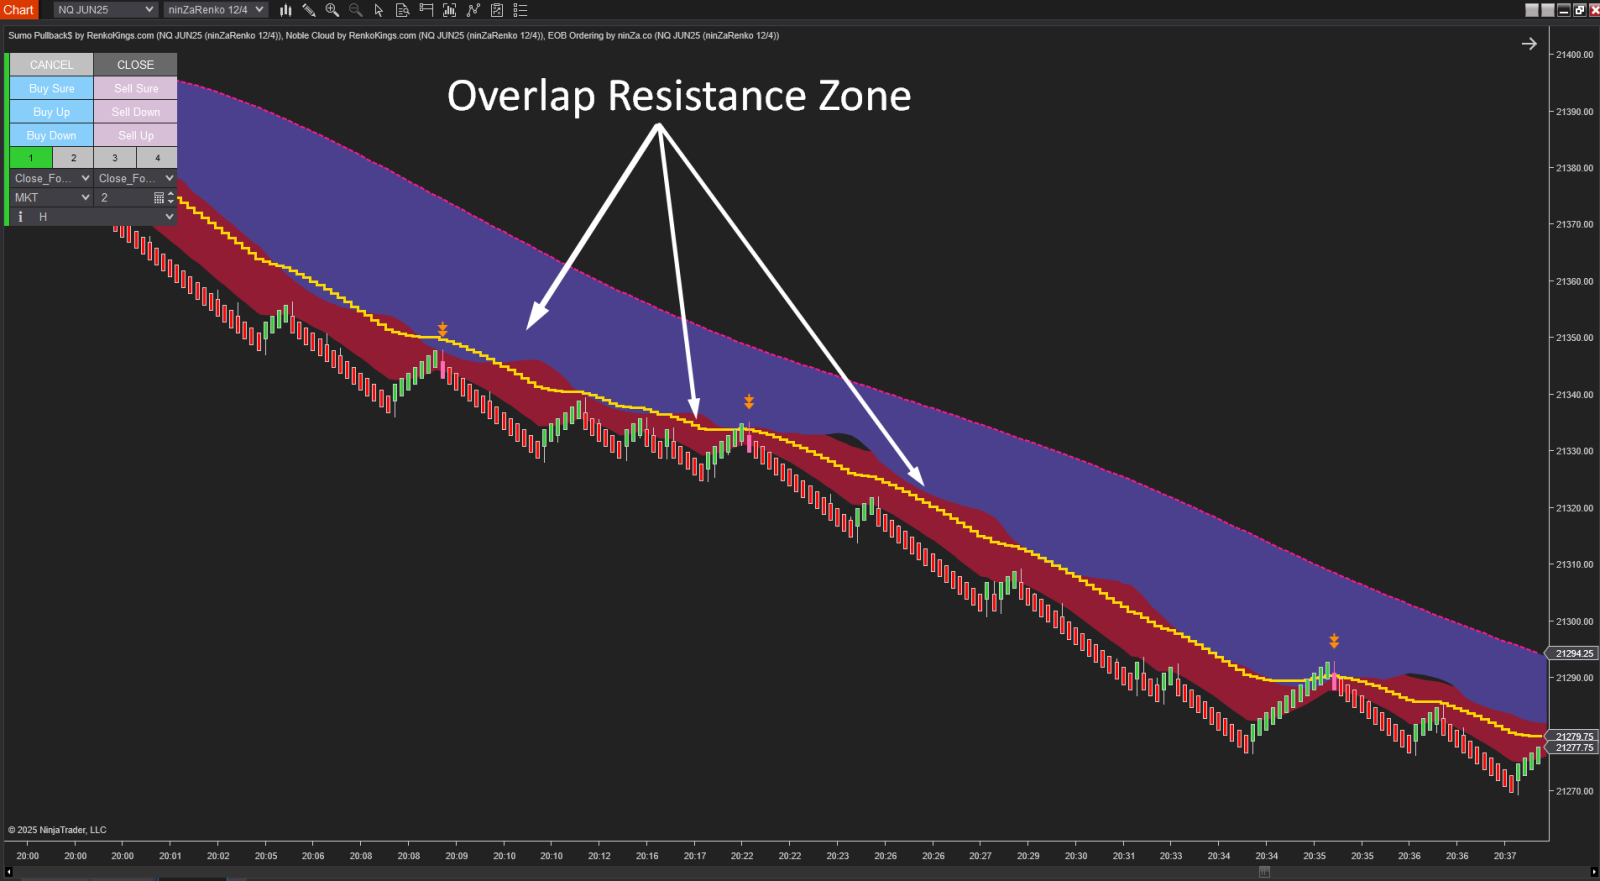
Its main strength lies in identifying pullbacks that occur with strong momentum, especially when price retraces and breaks through dense support or resistance zones (represented by cloud areas on the chart). These moments often indicate that the existing trend still holds strength and may continue after a short correction.
2. Noble Cloud – A Dynamic Representation of Price Movement
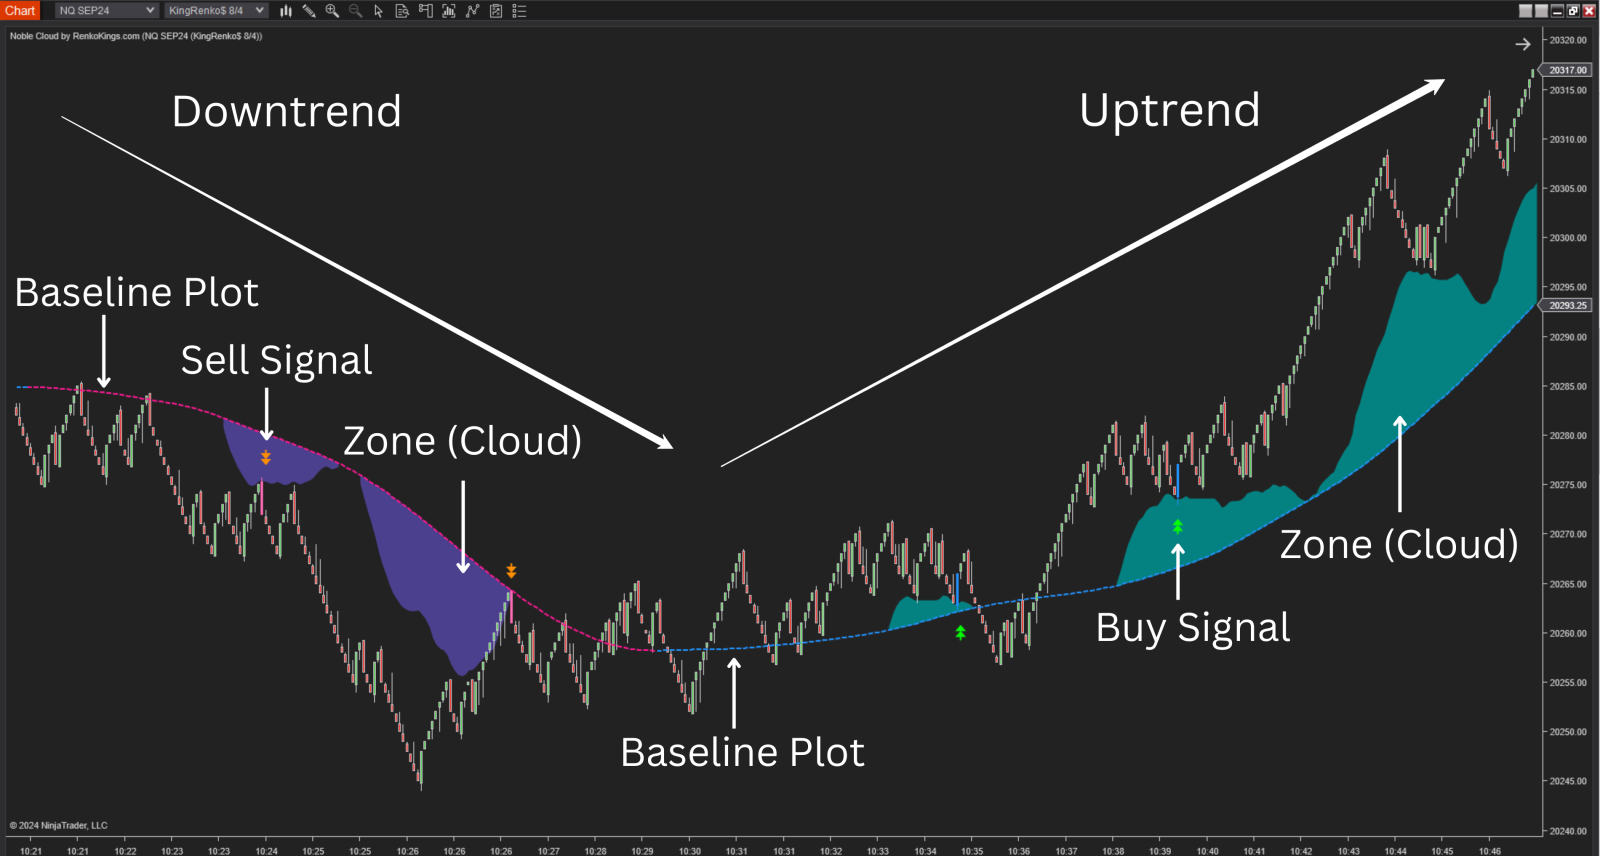
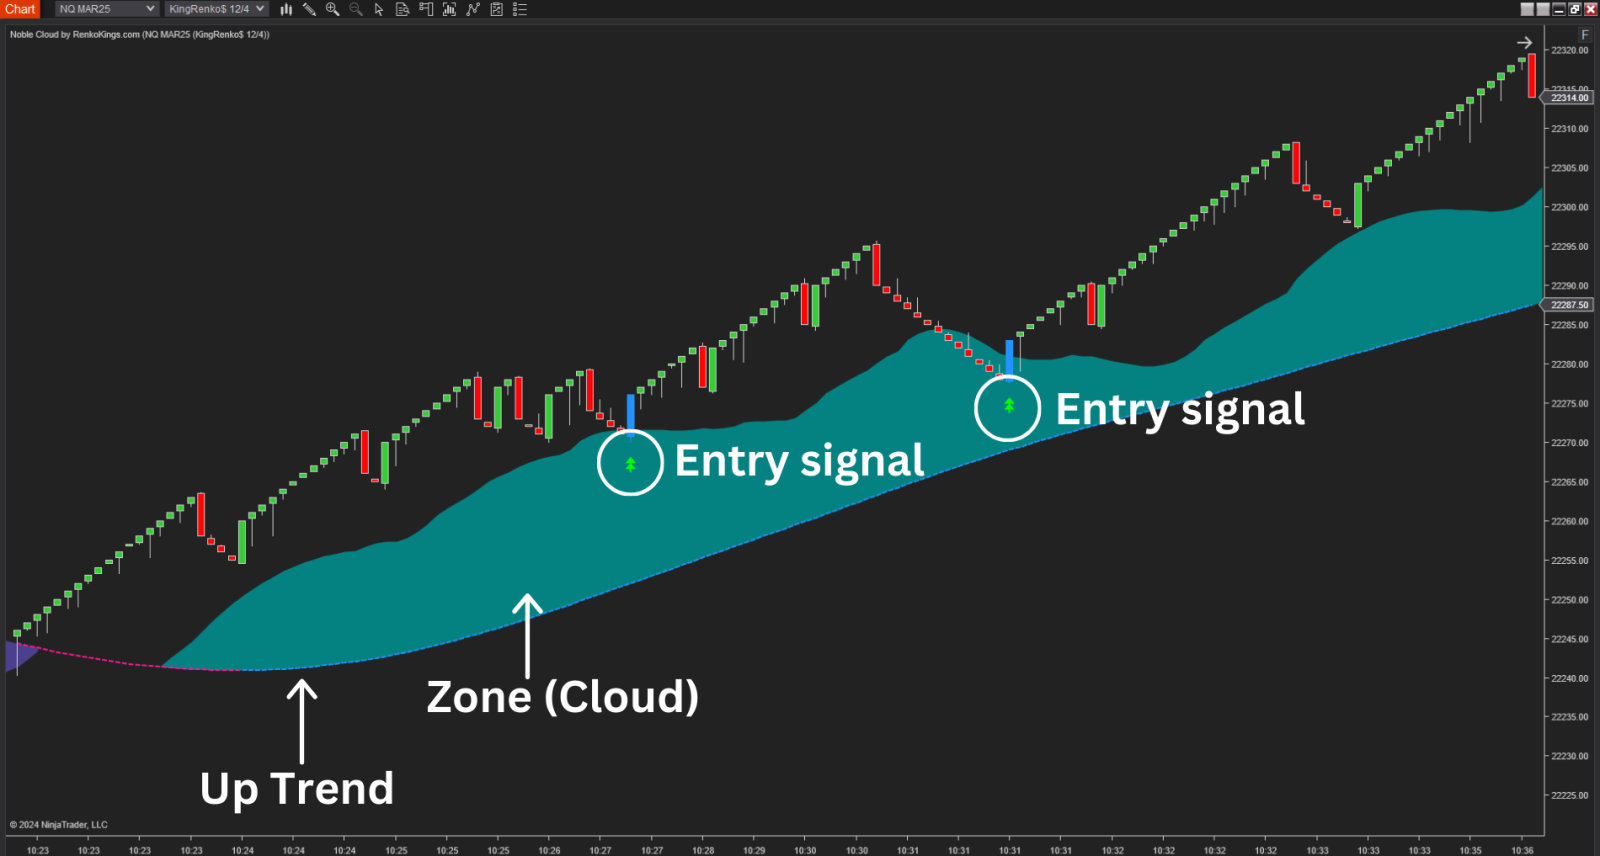
Noble Cloud offers a different perspective by using price behavior itself to form adaptive "cloud zones." These clouds expand and contract depending on market volatility:
Strong price movements → the cloud widens, highlighting active momentum
Consolidation or slowing momentum → the cloud contracts, signaling potential short-term range or early pullback area
This dynamic nature helps traders identify potential reaction zones that may not be visible through traditional moving averages or fixed-level indicators.
3. What Happens When You Combine Them ?
3.1. Stronger Support/Resistance Confirmation
When the clouds from both Sumo Pullback$ and Noble Cloud overlap at a price area, it creates a confluence zone. This type of overlap can increase the chance of price reacting to that area, either by continuing or pausing its current trend.
3.2. Overlapping Signals = Higher Confidence
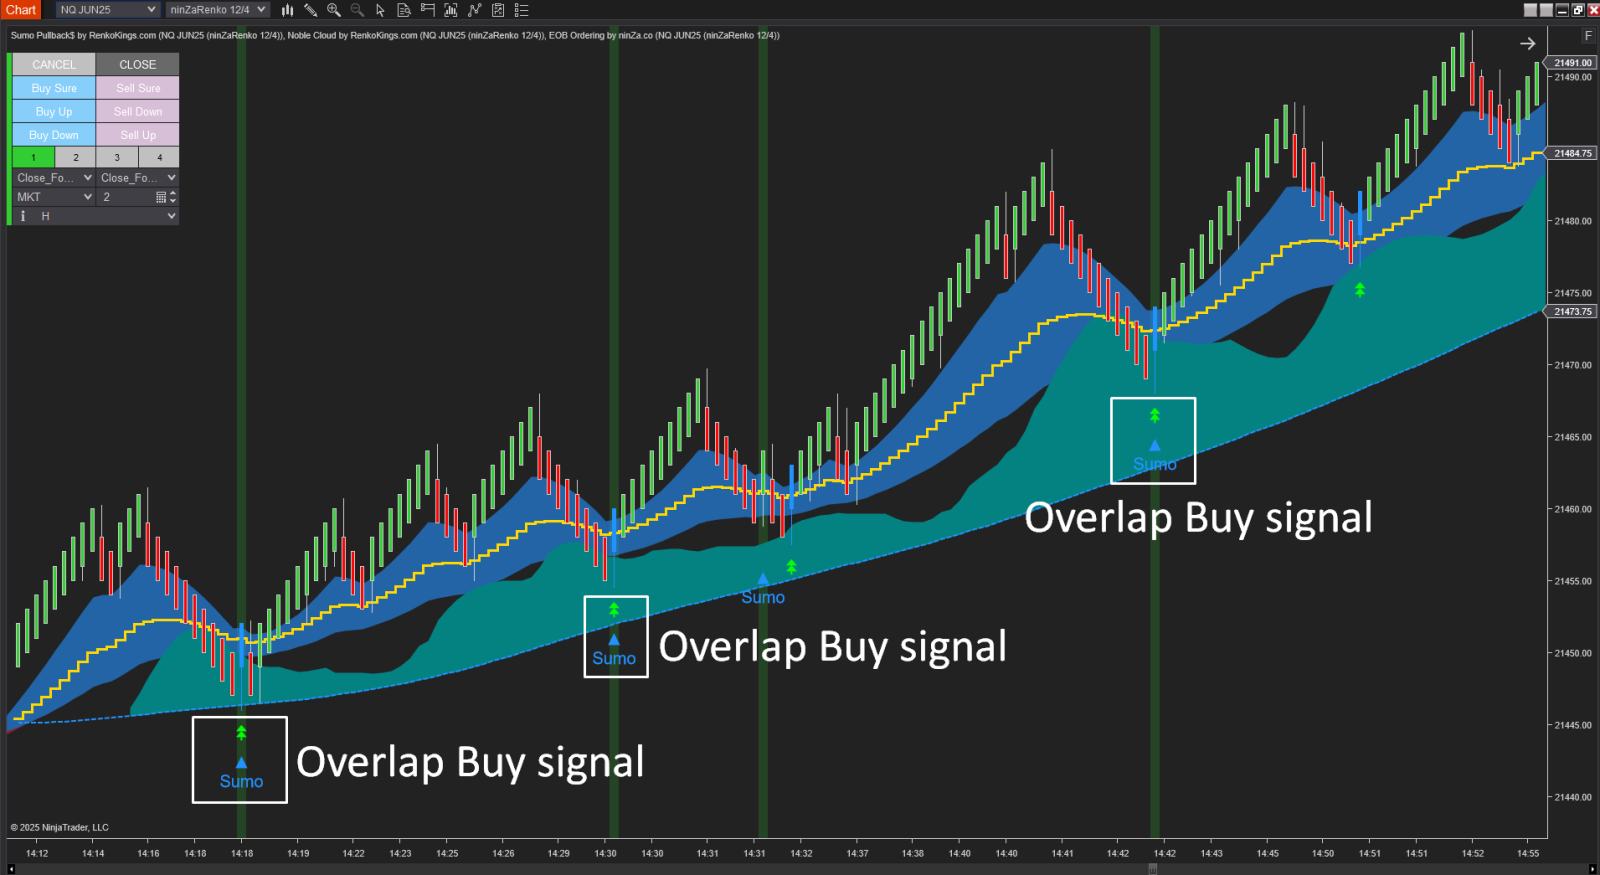
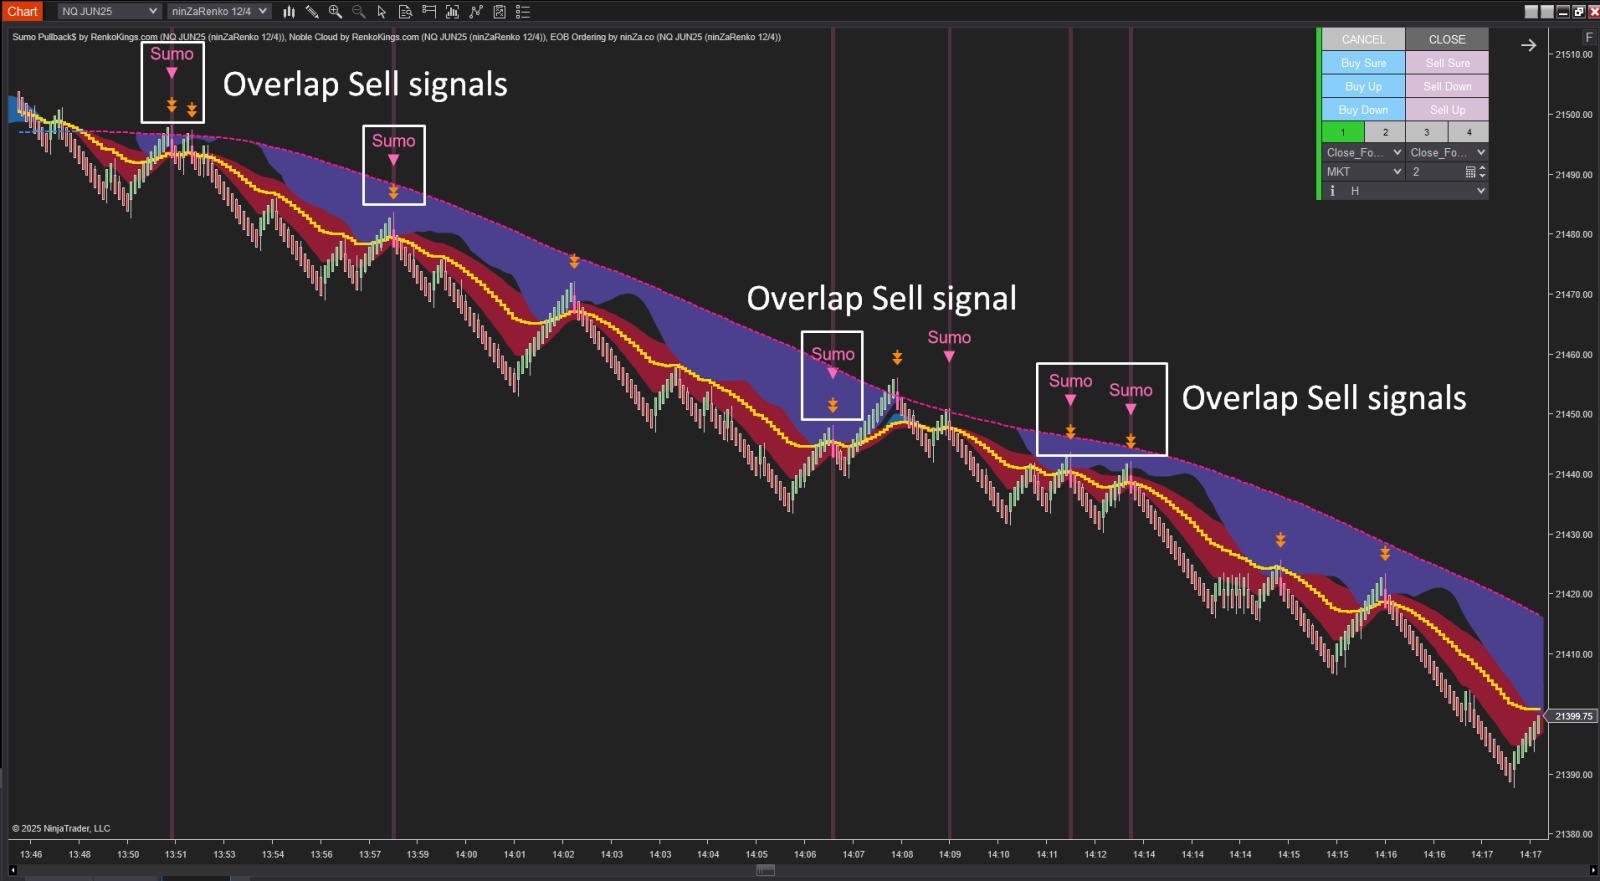
If both indicators produce a trade signal at or near the same time, this adds weight to the decision. Such overlapping signals can help traders avoid second-guessing their entries and stick with their trading plan more consistently.
3.3. Dual Trend Confirmation
Each indicator evaluates trend strength independently. When both point in the same direction (e.g., both showing a bullish trend), this can act as a secondary confirmation of the trend’s reliability, helping traders stay aligned with the market.
3.4. More Opportunities Without Chasing
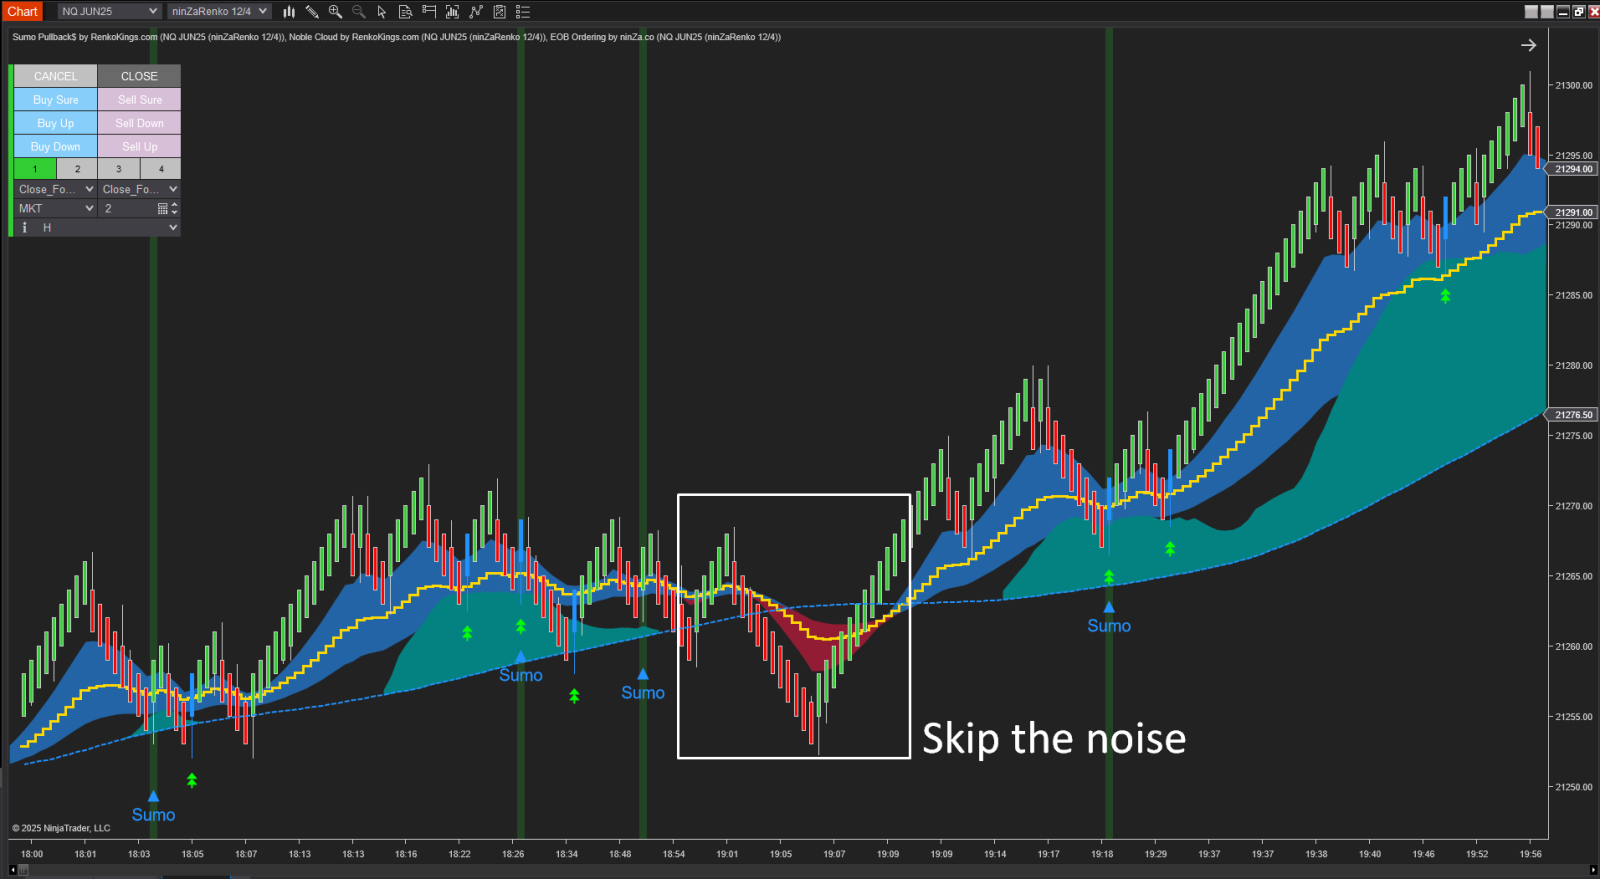
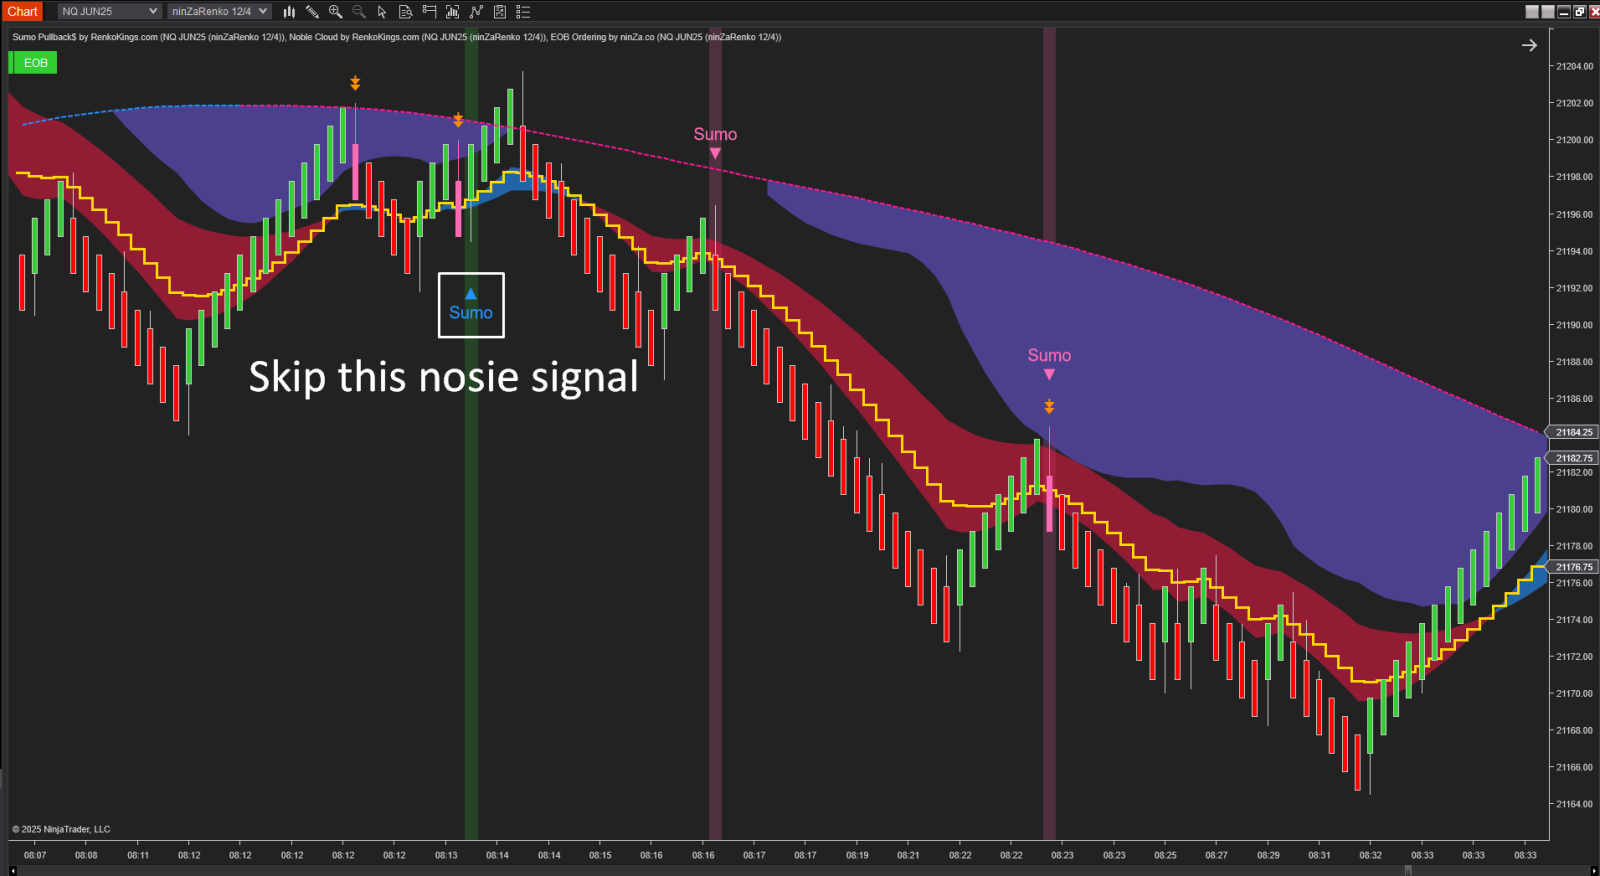
Noble Cloud’s broader price zone coverage offers more pullback detection points, giving trend-following traders more entry opportunities without needing to chase price or enter impulsively.
3.5. Filtering Weak Setups
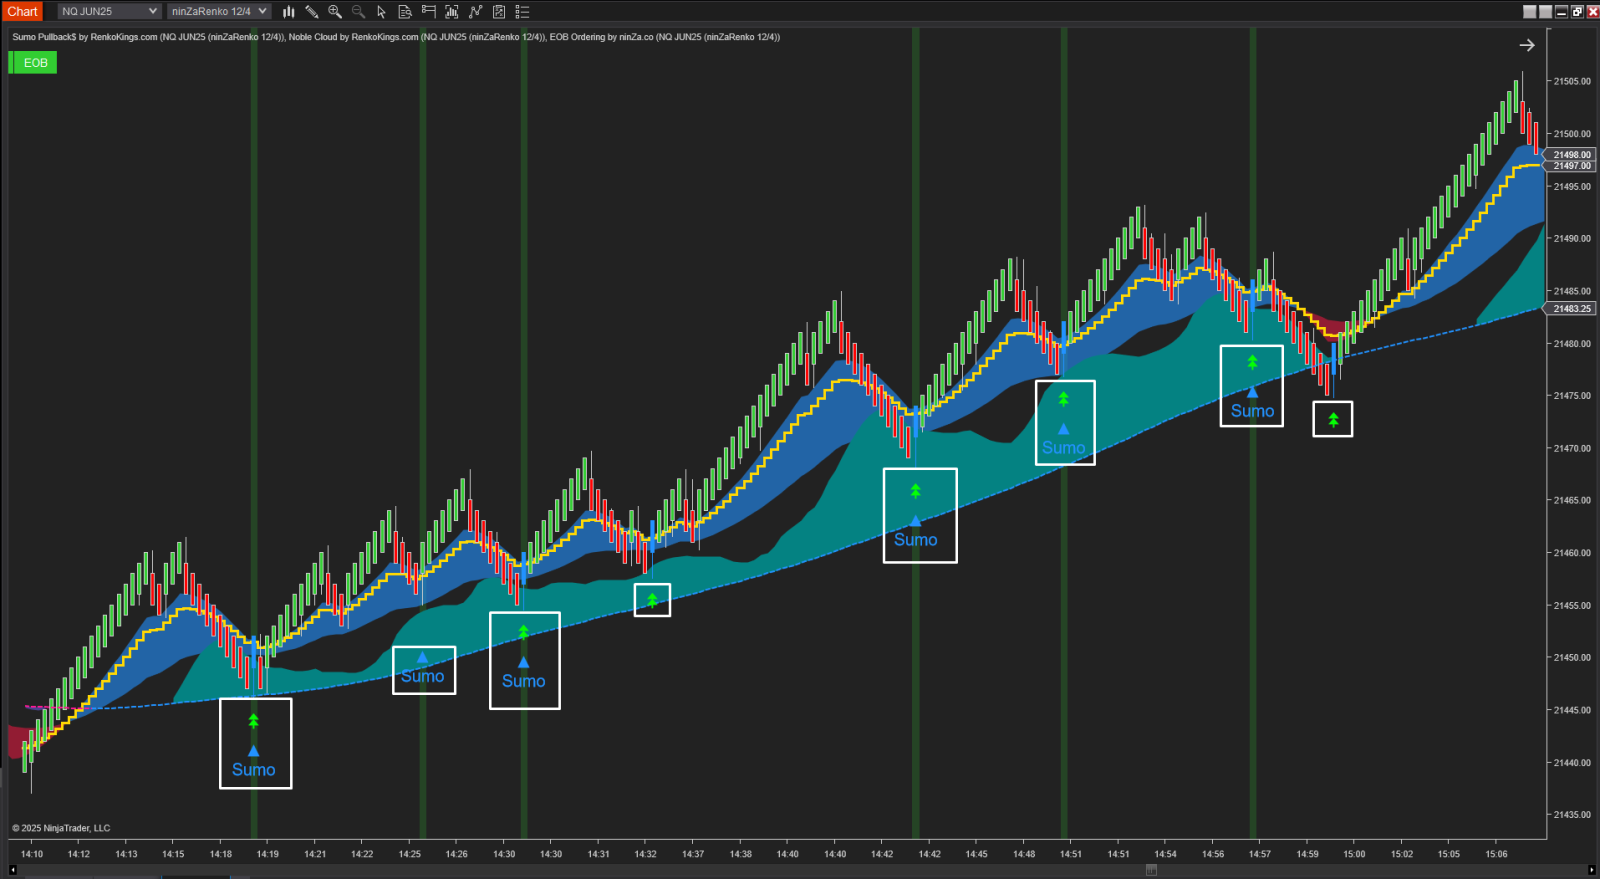
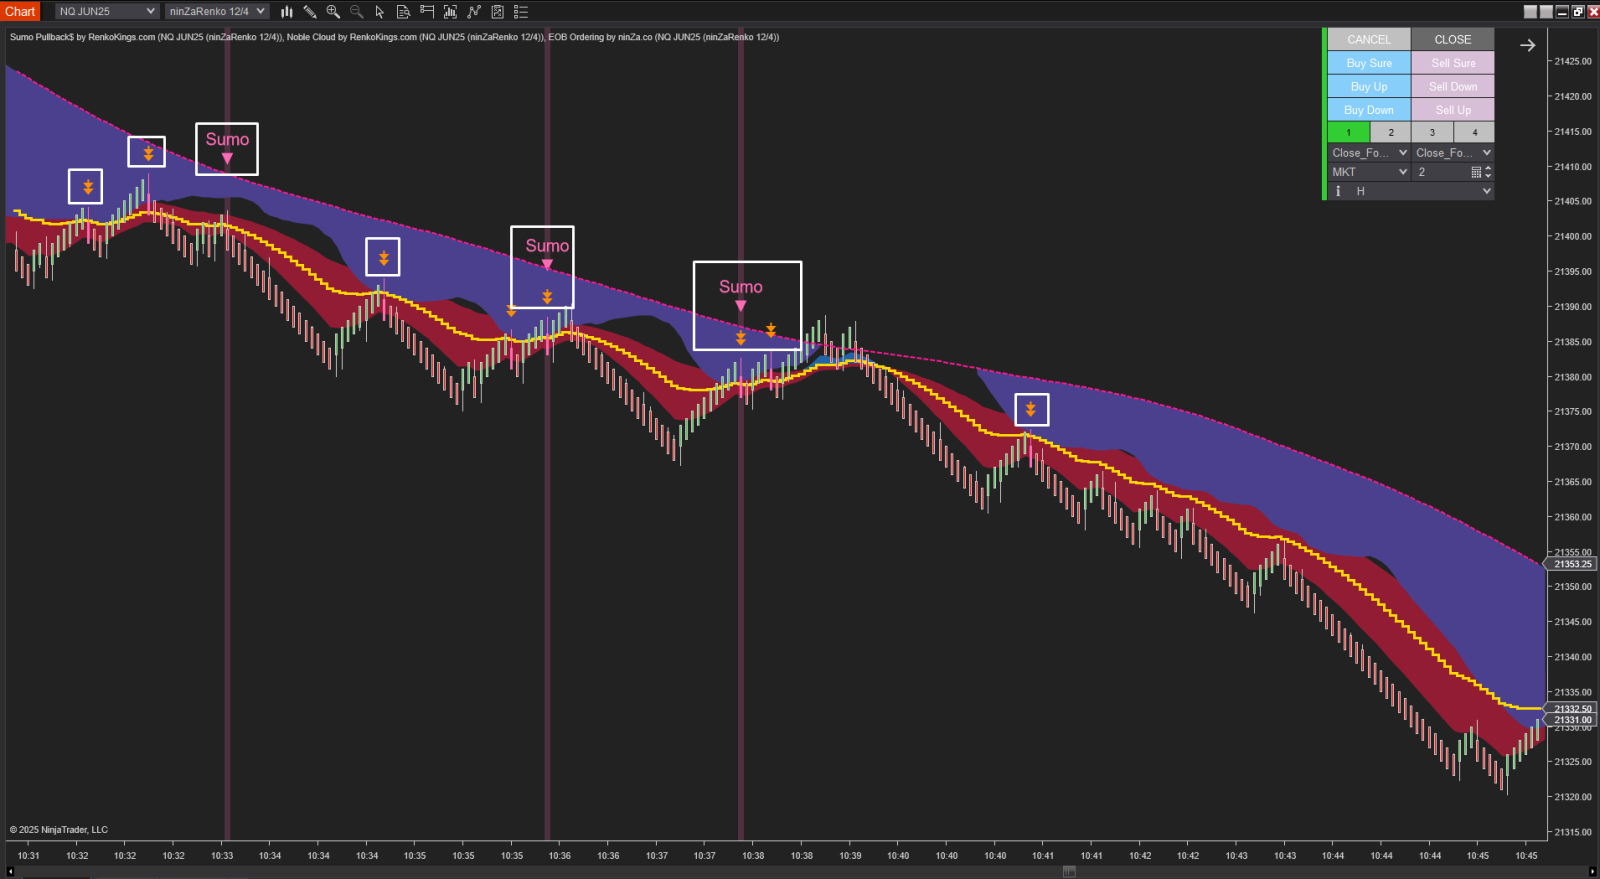
A practical filter: only consider signals from Noble Cloud if the signal candle breaks through the base line of Sumo Pullback$. If not, the signal may lack strength, helping you avoid weaker setups or false breakouts.
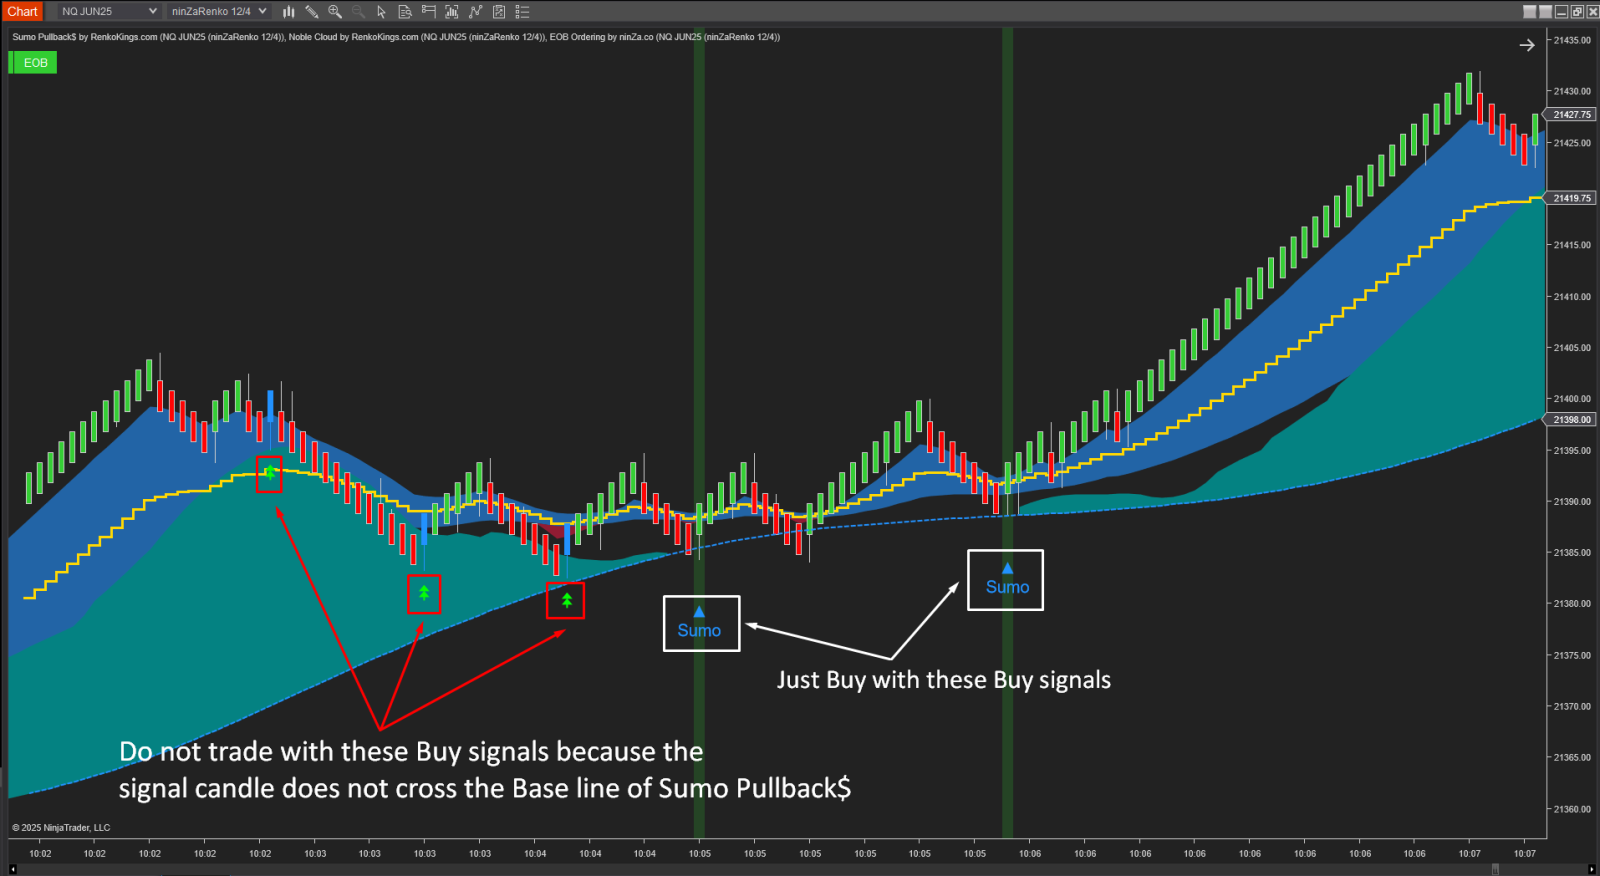
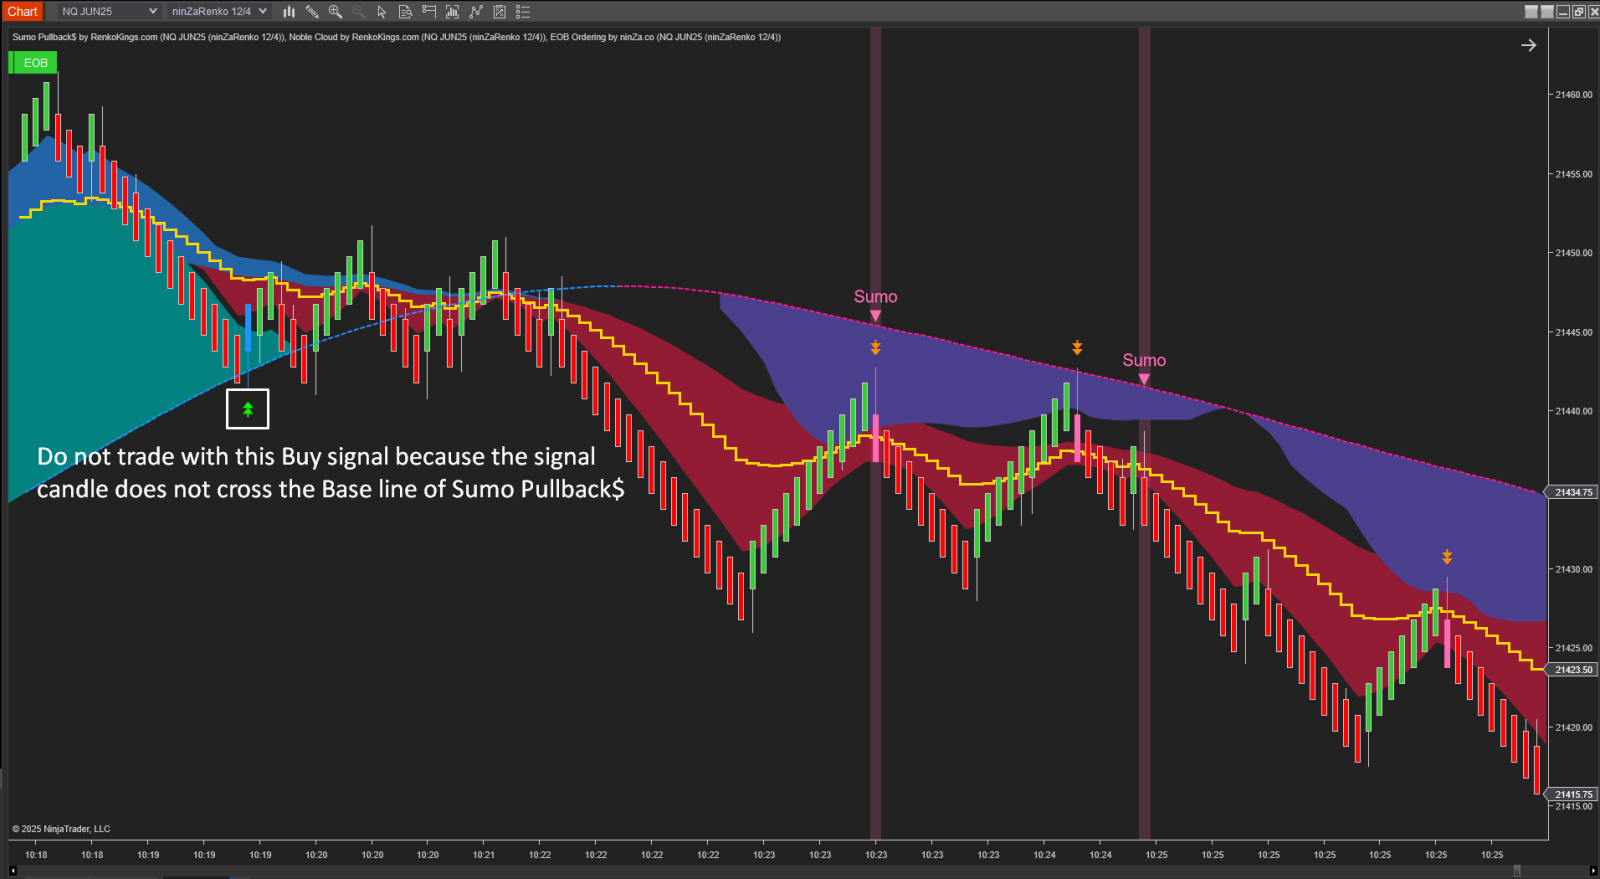
Sumo Pullback$ and Noble Cloud are two indicators that have been available for quite some time, and they continue to deliver value when used appropriately—especially within trend-following strategies.
This article was written with the intention of supporting traders who already own these two indicators, offering a more in-depth view on how combining them can help strengthen pullback confirmations and improve decision-making in trend continuation setups.
Here are some suggested settings you can try with popular Renko chart types:
Renko 20/5
Renko 12/4
Renko 15/5
….
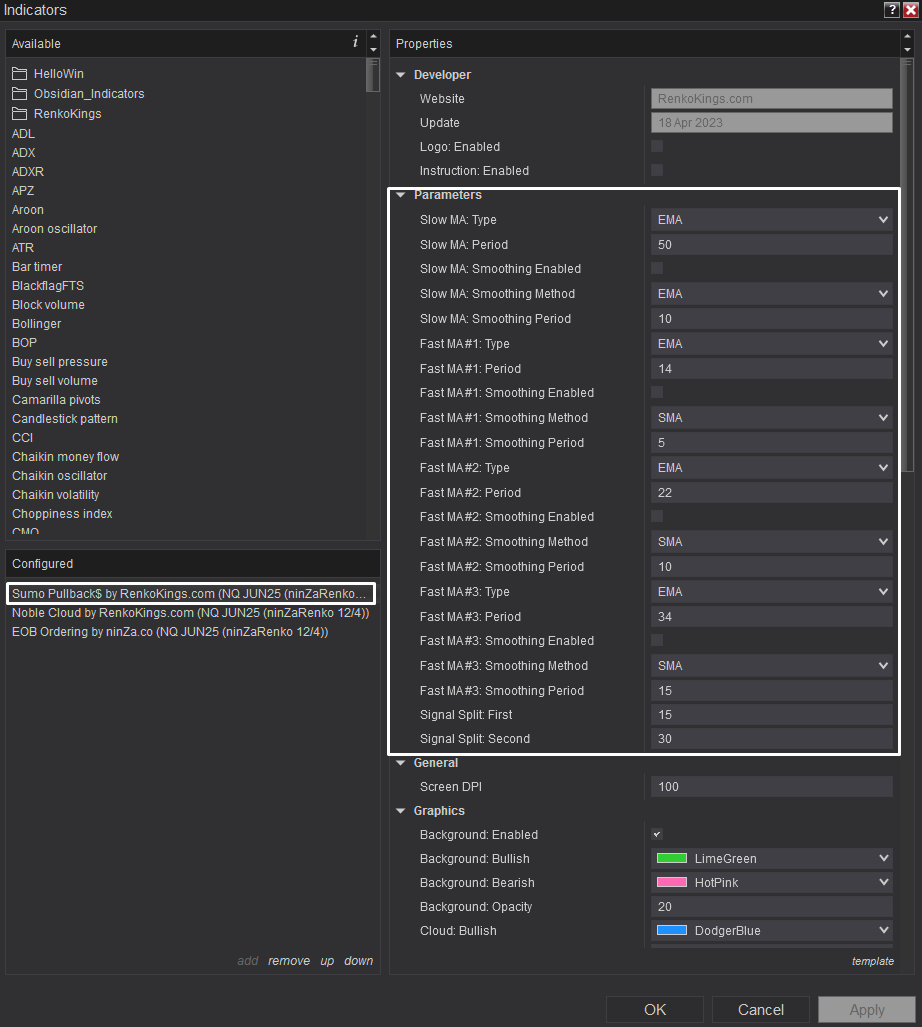
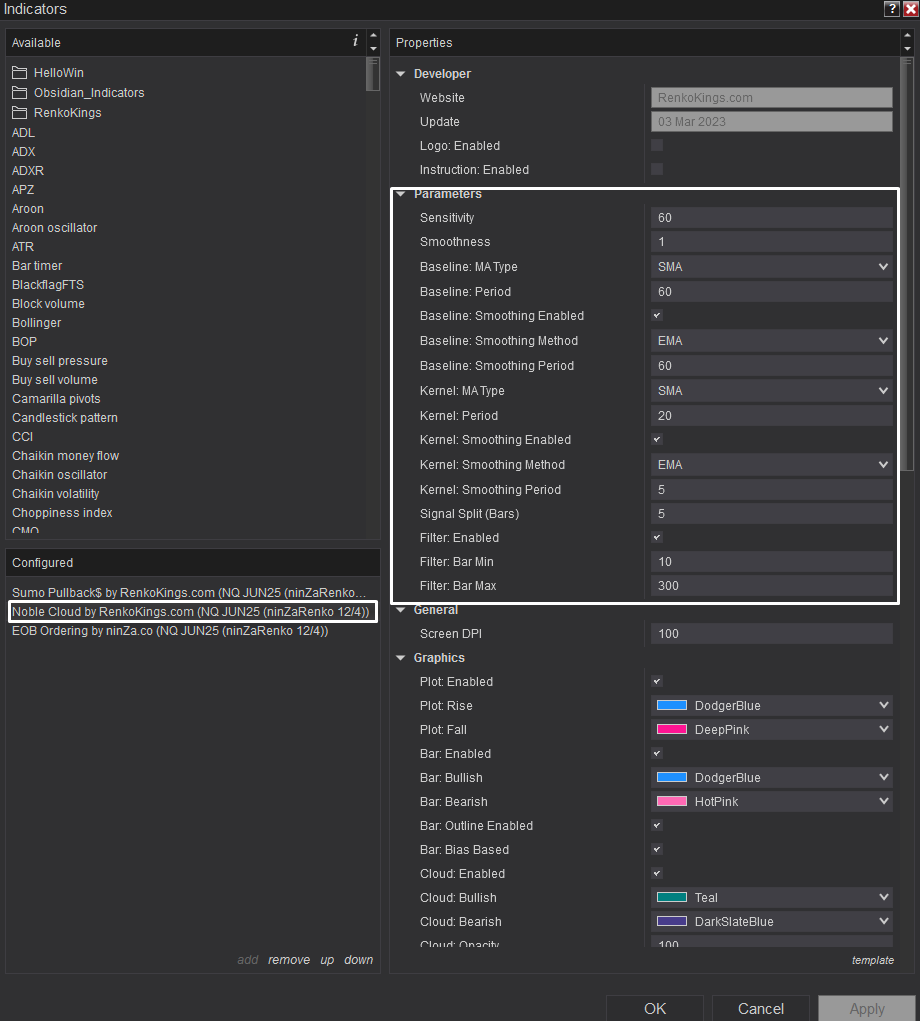
You may start with the default configurations, then adjust them based on your trading style and the specific market you’re analyzing.
If you haven’t yet accessed these indicators, you can find more details through the link below: