The hidden danger in most trading days
Most indicators traders use today are built for trending markets. They work best when price is rising steadily or falling cleanly. Think moving averages, trendlines, or momentum-based tools: they all assume the market is moving somewhere.
But what happens when the market stops moving and starts going sideways? That’s where things get messy. False signals. Choppy price action. Emotional trades. Small losses that stack up. If you’ve been there, you know the pain.
Sideways markets—also called consolidation, range, or chop—are the enemy of trend-following strategies. And they’re much more common than you might think.
Most of the market is Sideways
- Roughly 70% to 80% of the time, the market moves sideways.
- Only 20% to 30% of the time is there a clear trend.
That’s why recognizing sideways phases is critical. If you can spot them early, you can:
- Stay out and protect your capital
- Switch to range-based strategies
- Avoid false breakouts and fakeouts
- Read the market with more accuracy
In this blog, we’ll introduce you to 3 indicators designed specifically to detect sideways conditions so you can stop fighting chop blindly.
1. Sidewayz RT – Based on Running Total
Sidewayz RT (RT = Running Total) analyzes the bias of each bar:
- +1 for bullish
- -1 for bearish
- 0 for neutral
Then, it adds up these bias values over a certain number of bars (you define the "lookback").
If the total bias stays within a small range for a defined number of bars in a row (the “threshold-met span”), the market is likely sideways.
Why it works: In a trend, the running total grows strongly in one direction. But during chop, the values cancel each other out. This gives you a dynamic way to detect when the market has lost its trend strength, even before it becomes obvious visually.

2. Sidewayz ZP – Based on Zero Percentage
Sidewayz ZP (ZP = Zero Percentage) also reads bar bias but focuses on neutral bars (bias = 0).
It calculates the percentage of neutral bars in a given lookback period. If that percentage remains high for several bars, it means the market is indecisive and likely sideways.
When it shines: This is especially helpful in low-volatility conditions or during lunchtime sessions where price just drifts. If your strategy performs poorly when there's no clear bias in the bars, this indicator can help you filter those moments out.

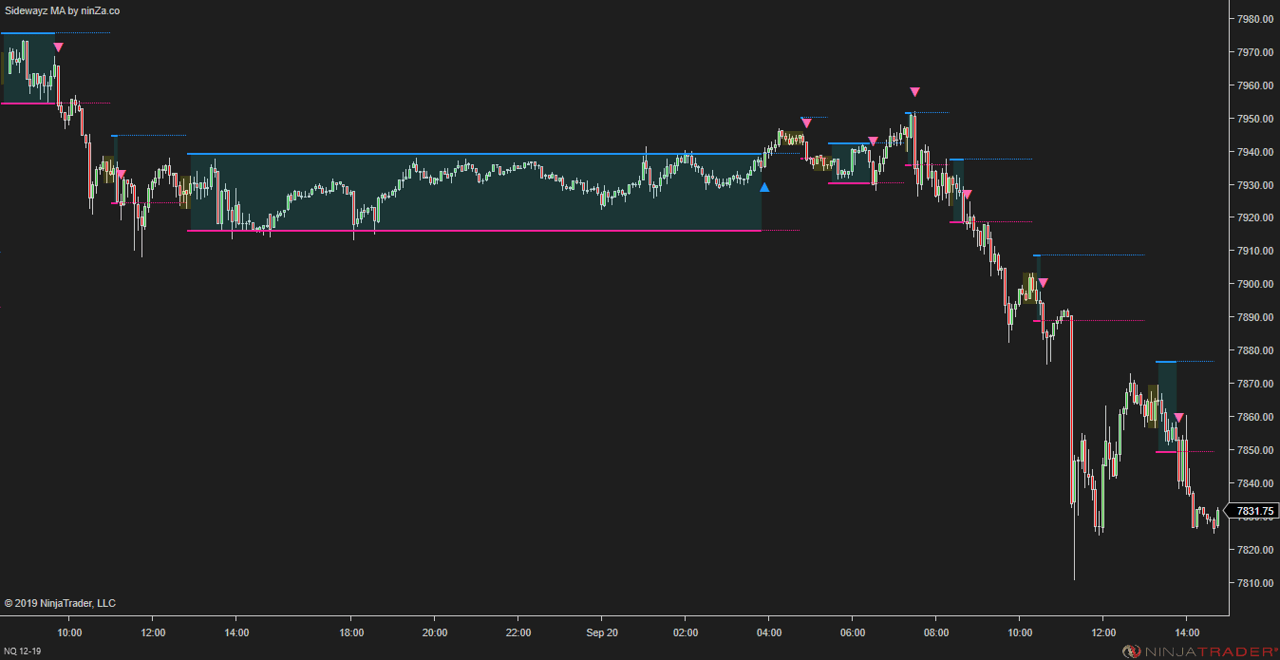
3. Sidewayz MA – Based on Moving Average Crosses
Sidewayz MA looks at 2 very short-period moving averages.
In trending markets, these MAs spread apart. But when the market is sideways, they cross frequently and stay close together. Sidewayz MA measures how often these crossovers happen within a narrow band.
Practical use: Great for visual traders who like to “see” how tight or loose the market is. This tool gives a clean, moving-average-based way to detect chop, ideal for short-term charts.
Quick comparison: When to use Sidewayz RT, ZP, or MA?
| Indicator | Best for… | Key Logic | Ideal Timeframes |
|---|
| Sidewayz RT | Measuring directional bias over time | Running total of bias | All timeframes |
| Sidewayz ZP | Spotting indecision / low momentum | % of neutral bars | Best in calm sessions |
| Sidewayz MA | Visual detection of tight-range action | MA crossover frequency | Scalping, intraday |
- Use Sidewayz RT when you want precise control over what counts as “directional”
- Use Sidewayz ZP when you want to catch zones with lots of neutral movement
- Use Sidewayz MA if you’re a visual trader or rely on moving average behavior
If you’ve made it this far, here’s a quiet little bonus: you can get Sidewayz RT, Sidewayz ZP, and Sidewayz MA together for just $396.