Catching a reversal at the right time can deliver outstanding profits with just a few trades per month. However, it’s also one of the most difficult and risky strategies.
This article will show you how to:
Identify reliable reversal signals using strong technical tools
Understand why reversal trades typically have low win rates but high rewards
Apply effective trading and position-sizing strategies tailored for reversals
1. Why Reversal Trading Has a Low Win Rate but High Profit Potential
Reversal trading is not about following the trend. It’s about catching the turning point, whether it’s the top of an uptrend or the bottom of a downtrend.
❗ There’s only one real turning point in any trend
Most of the time, price moves in one direction. Trying to catch reversals before the actual turning point usually results in premature entries, stop-outs, or fakeouts - which is why the win rate tends to be low.
However, when you do catch a valid reversal:
You get in right at the start of a new trend
Your Risk:Reward ratio can be extremely high (1:5, 1:7, even 1:10)
Just a few successful trades can make up for a string of small losses and leave you with solid net profit
2. How to Identify Reliable Reversal Signals
To avoid emotional or random entries, you need a structured system of confirmation. The strategy below combines technical indicators with price behavior on Renko charts to provide high-confidence reversal setups.
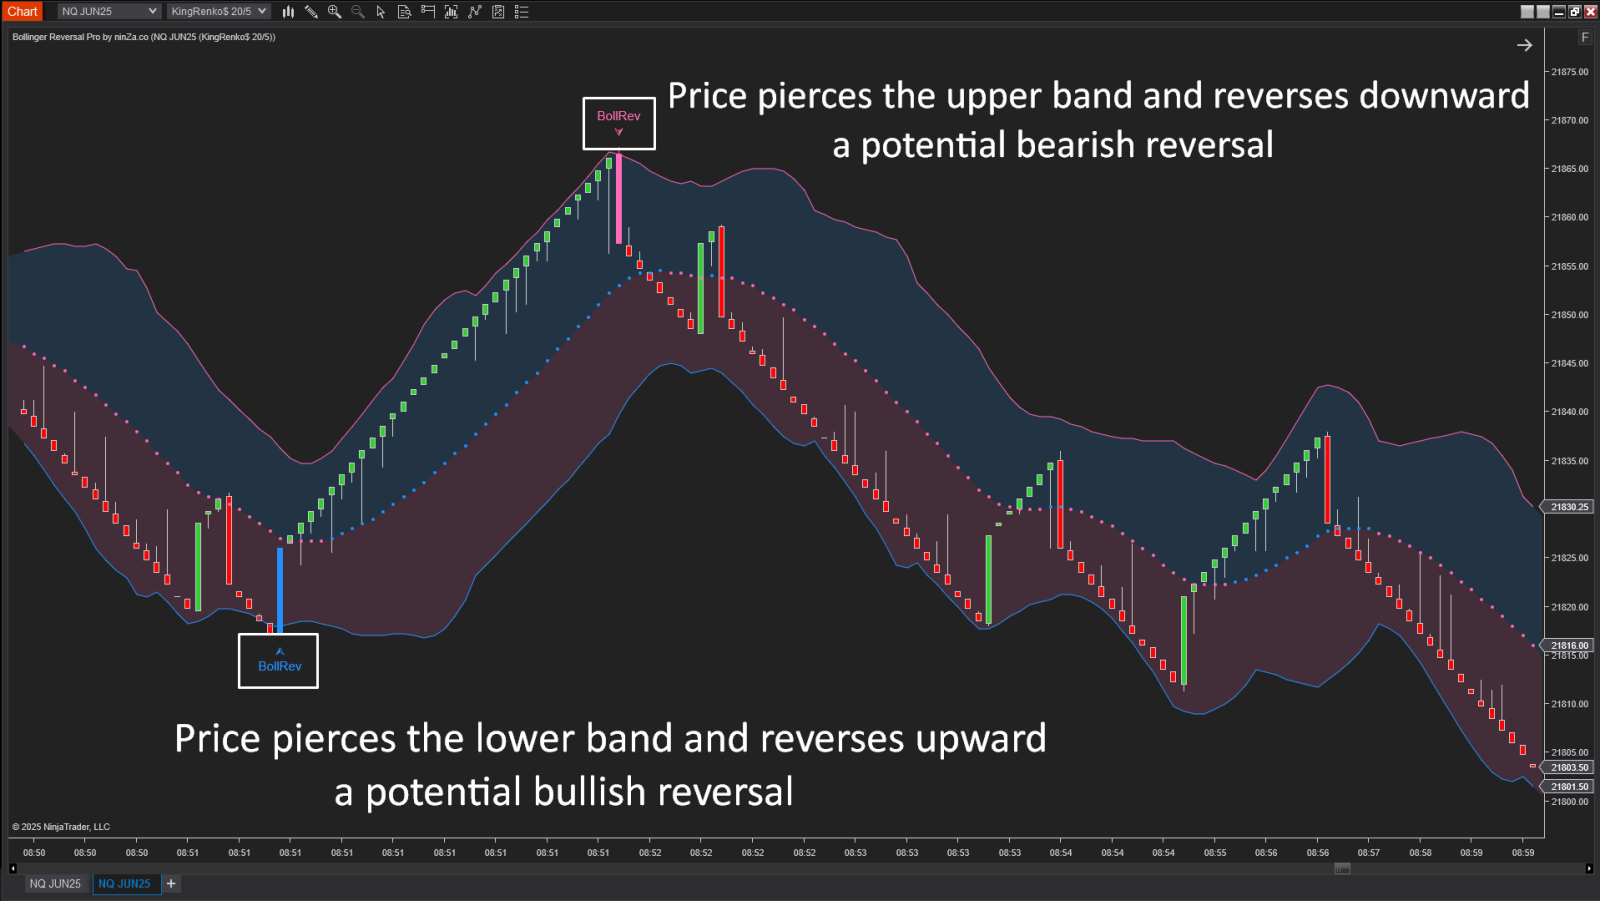
🔹 Bollinger Reversal Pro – The "Mean Reversion" effect
When price pierces above the upper band, it often snaps back toward the middle or lower band
Conversely, a break below the lower band often triggers a strong rebound
This reflects a mean reversion tendency - an early clue that the market is stretched and may soon reverse.
Bollinger Reversal Pro indicator is a tool that allows traders to identify reversal points when the price breaks above the upper band or below the lower band.

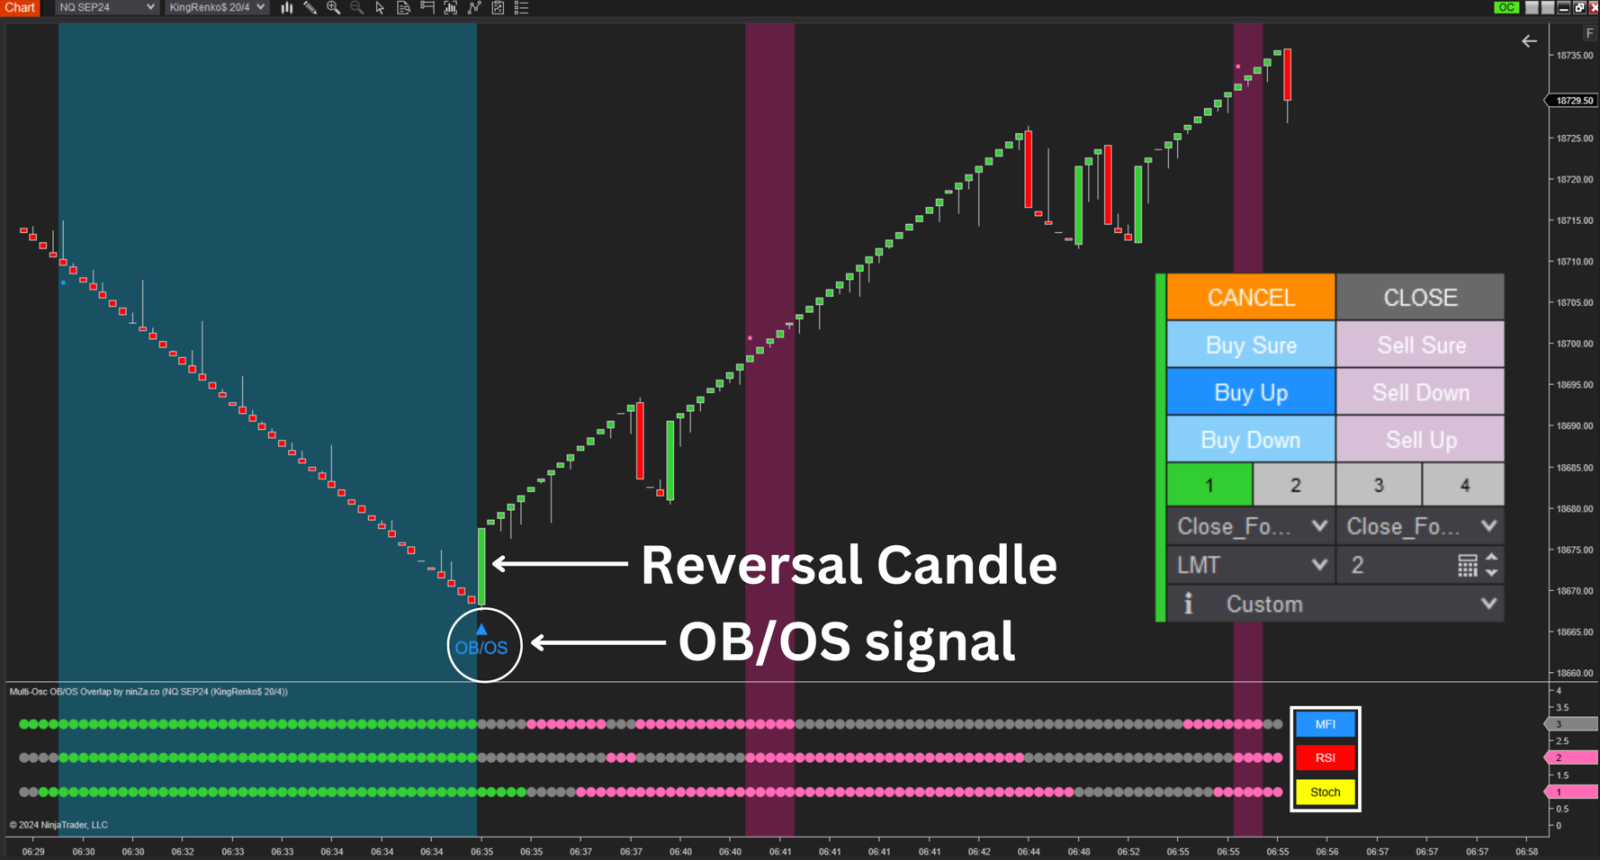
🔹 Multi-Osc OB/OS Overlap – Confirmation from 3 Oscillators
A single indicator is never enough. This strategy combines 3 classic momentum oscillators into a single signal:
➡️ When all three enter overbought or oversold territory at the same time, they form a powerful reversal overlap zone.

🔹 Renko Charts – Clearer Price Action and Precise Entry Timing
Instead of traditional candlesticks, this strategy uses Renko charts (KingRenko$ or ninZaRenko), which filter out noise by focusing solely on price movement rather than time.
The key advantage of Renko here is the ability to identify clean and distinct reversal candles.
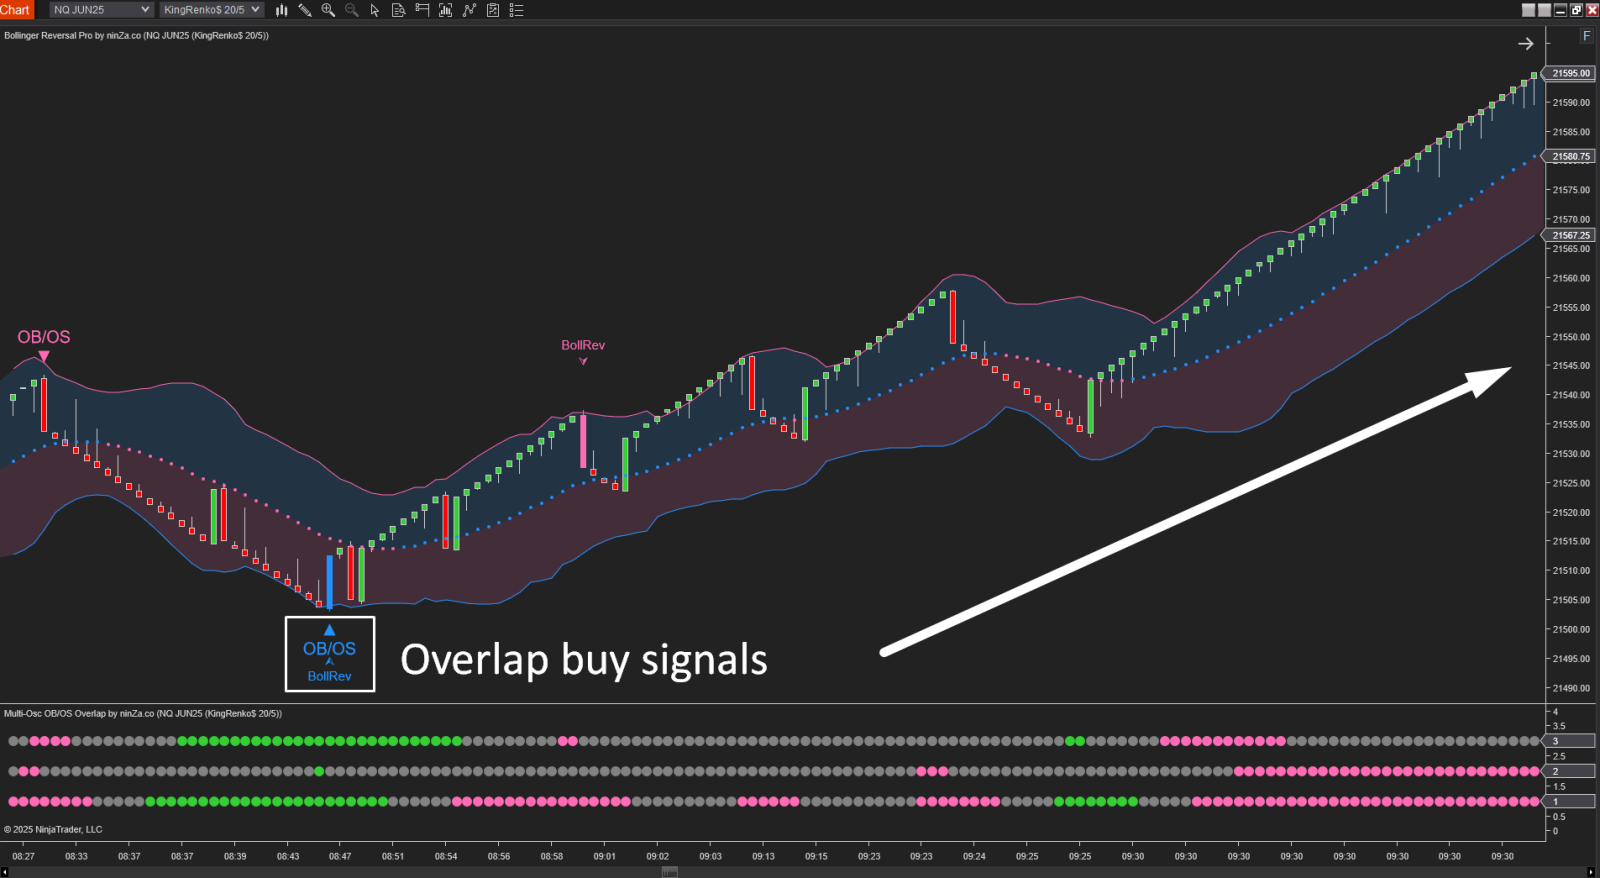
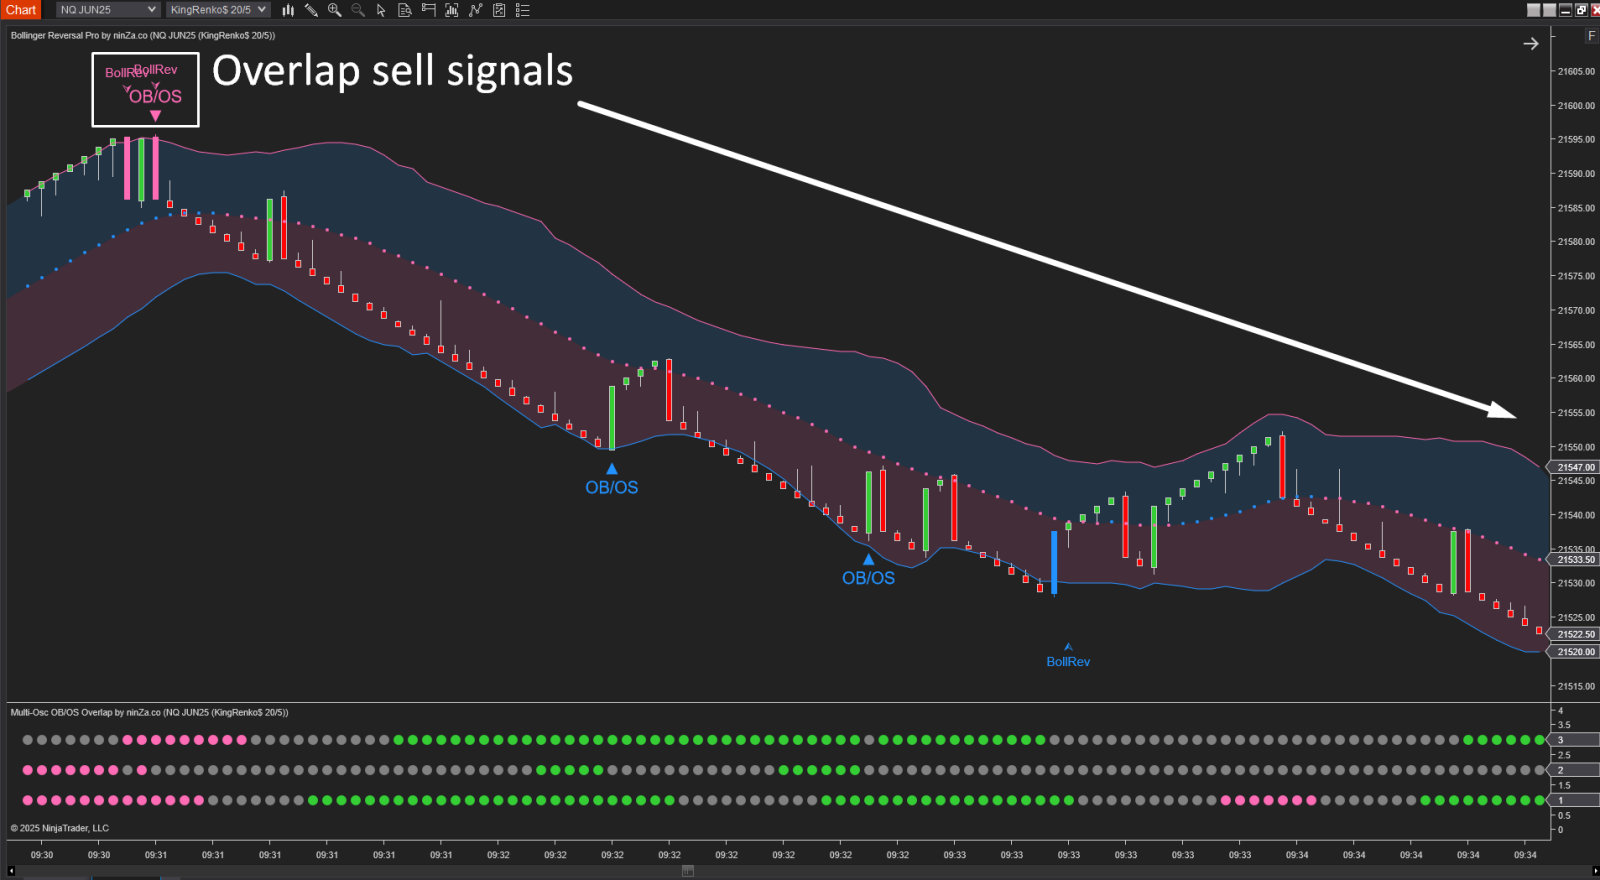
When both Bollinger Reversal Pro and Multi-Osc OB/OS Overlap occur on the same Renko reversal brick, it provides an ideal condition for entry.
This confluence of signals - two strong technical confirmations appearing on a single, well-defined Renko reversal bar - significantly enhances the reliability of the setup.
➡️ The Renko reversal bar becomes your execution trigger, ensuring you only act when both context and momentum align.


I’ve shared with you the full mechanism and how to combine these two indicators:
Bollinger Reversal Pro: https://ninza.co/product/bollinger-reversal-pro
Multi-Osc OB/OS Overlap: https://ninza.co/product/multi-osc-obos-overlap
In the next post, I’ll reveal the best ways to trade reversals effectively.
If you’ve got any cool reversal trading tips, don’t hesitate to share them with everyone!