Hello there, Zina here!
If you’ve ever taken a trade based on what seemed like a clear signal but ended up with disappointing results, chances are you overlooked some important confirmation factors. Today, I’m sharing 3 practical methods that can help you evaluate your trading signals more comprehensively - and dramatically improve your trading performance.
Method 1: Validate signals through the consensus of multiple technical factors
A trading signal is only truly reliable when it’s confirmed by multiple technical factors at once.
For example:
When several indicators simultaneously enter overbought or oversold territory, the probability of a reversal increases.
If the price approaches a strong support zone that is confirmed by several different tools, then any pullback signal in that area becomes more trustworthy.
Or, if a signal candle pattern forms exactly at a key Fibonacci level, and price action confirms it, that becomes a high-probability entry point.

The key mindset here is: Don’t rush into a trade just because of a single signal — instead, look for confluence between different elements to strengthen your conviction before acting.
Method 2: Check for consensus across multiple timeframes
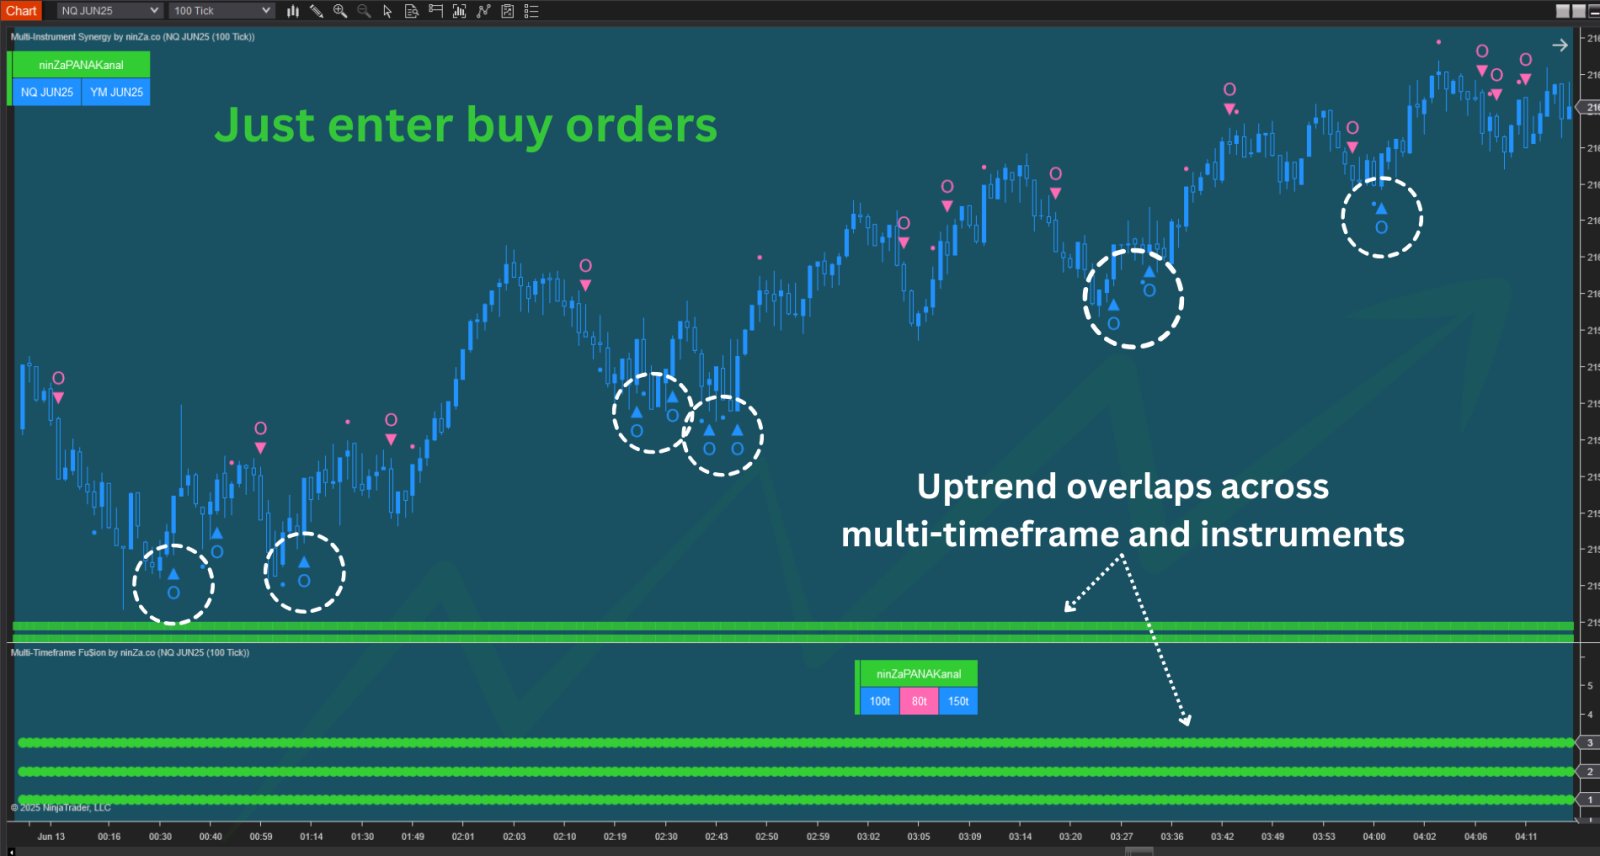
The reliability of your signals improves when you confirm them across various timeframes. For instance, a bullish signal on a 1-hour chart has more weight when it also aligns with the daily or weekly timeframe. When all timeframes show the same trend direction, the likelihood of success is much higher.
This approach is about looking at the bigger picture while still being in tune with shorter-term price action. It’s not just about what happens right now – it’s about how the market has behaved across different periods.
Method 3: Integrate multi-instrument analysis
Don’t limit your analysis to just one instrument. A key technique used by professional traders is evaluating the relationship between multiple markets to gain a clearer view of overall market sentiment.
What matters here is whether instruments are positively or negatively correlated — whether they are moving in sync or in opposite directions.
For example:
When major indices like NQ, ES, and YM are all rising together, this positive correlation reflects broad market strength and reinforces a bullish outlook.
Conversely, if NQ starts to fall while gold (GC) rises, this negative correlation may suggest that risk sentiment is weakening — a warning that NQ could be heading into a correction.
Understanding these intermarket correlations helps you confirm the reliability of your signals and make more informed decisions about entering or exiting trades.

💡 The Solution:
To effectively apply the 3 methods above, you need specialized tools tailored to each type of analysis. Below are the tools that best support this strategy:
🛠 Multi-Osc OB/OS Overlap – Powerful support for method 1
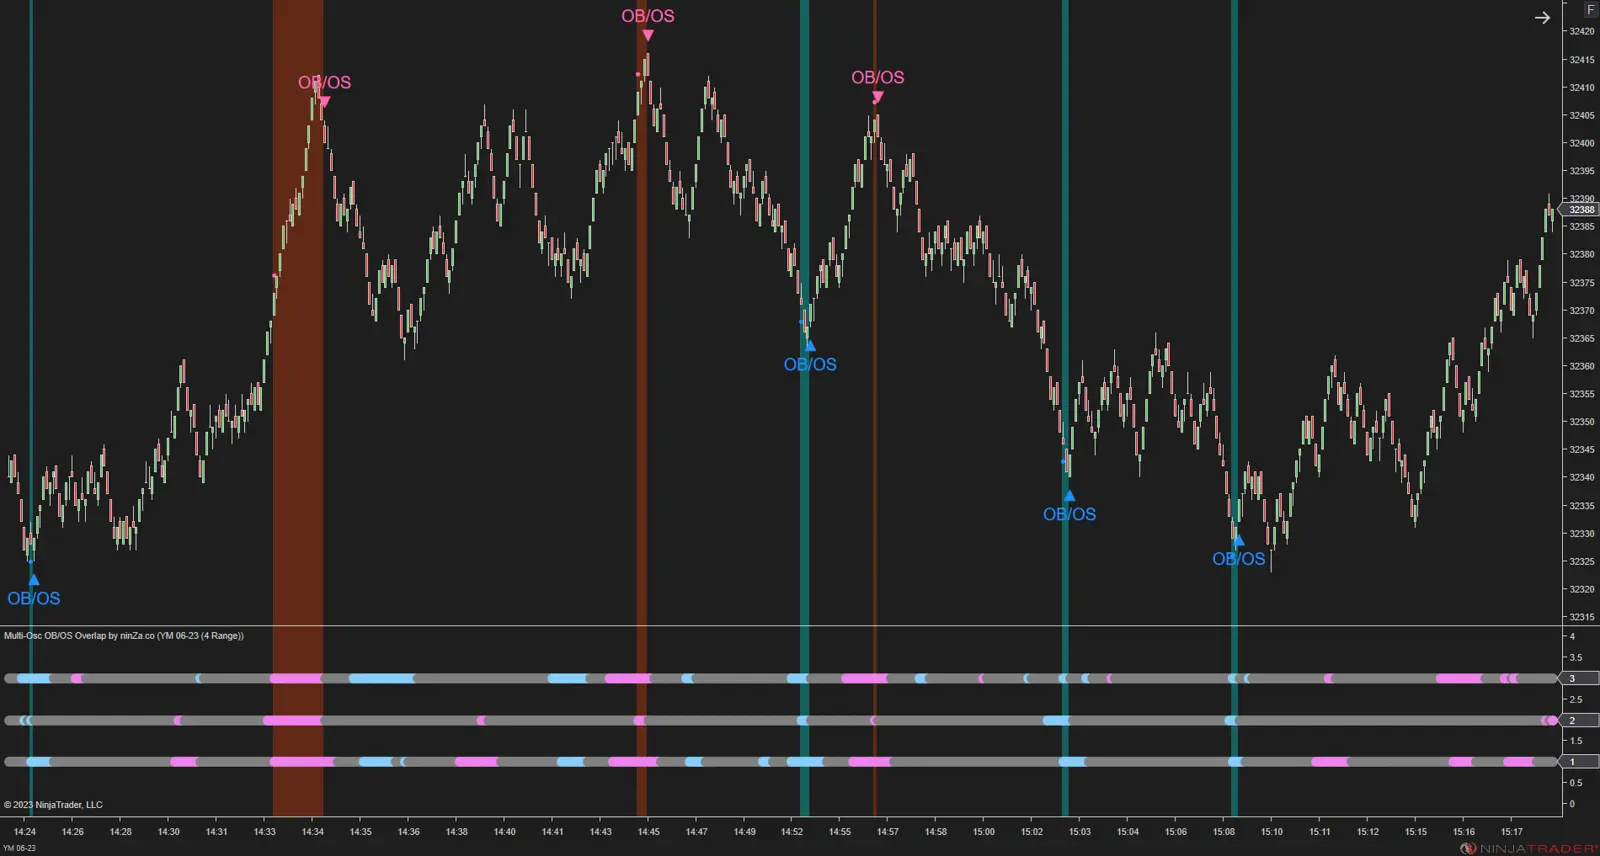
For Method 1 – Confirming signals through indicator Consensus, you can enhance your strategy with Multi-Osc OB/OS Overlap.
This indicator combines the overbought/oversold readings of three widely used oscillators – RSI, MFI, and Stochastic – and highlights high-probability reversal zones directly on the chart through background color and markers. It saves time and simplifies signal validation by offering a visual, unified view of oscillator agreement.
📦 Alpha Wolf Trading – The all-in-one package
🔹 PANA Kanal
This is the core of the system. It identifies trend direction, dynamic support/resistance, and key pullback or breakout areas. PANA Kanal gives you a clear market context so you can anchor your decisions confidently.
🔹 Multi-Timeframe Fu$ion
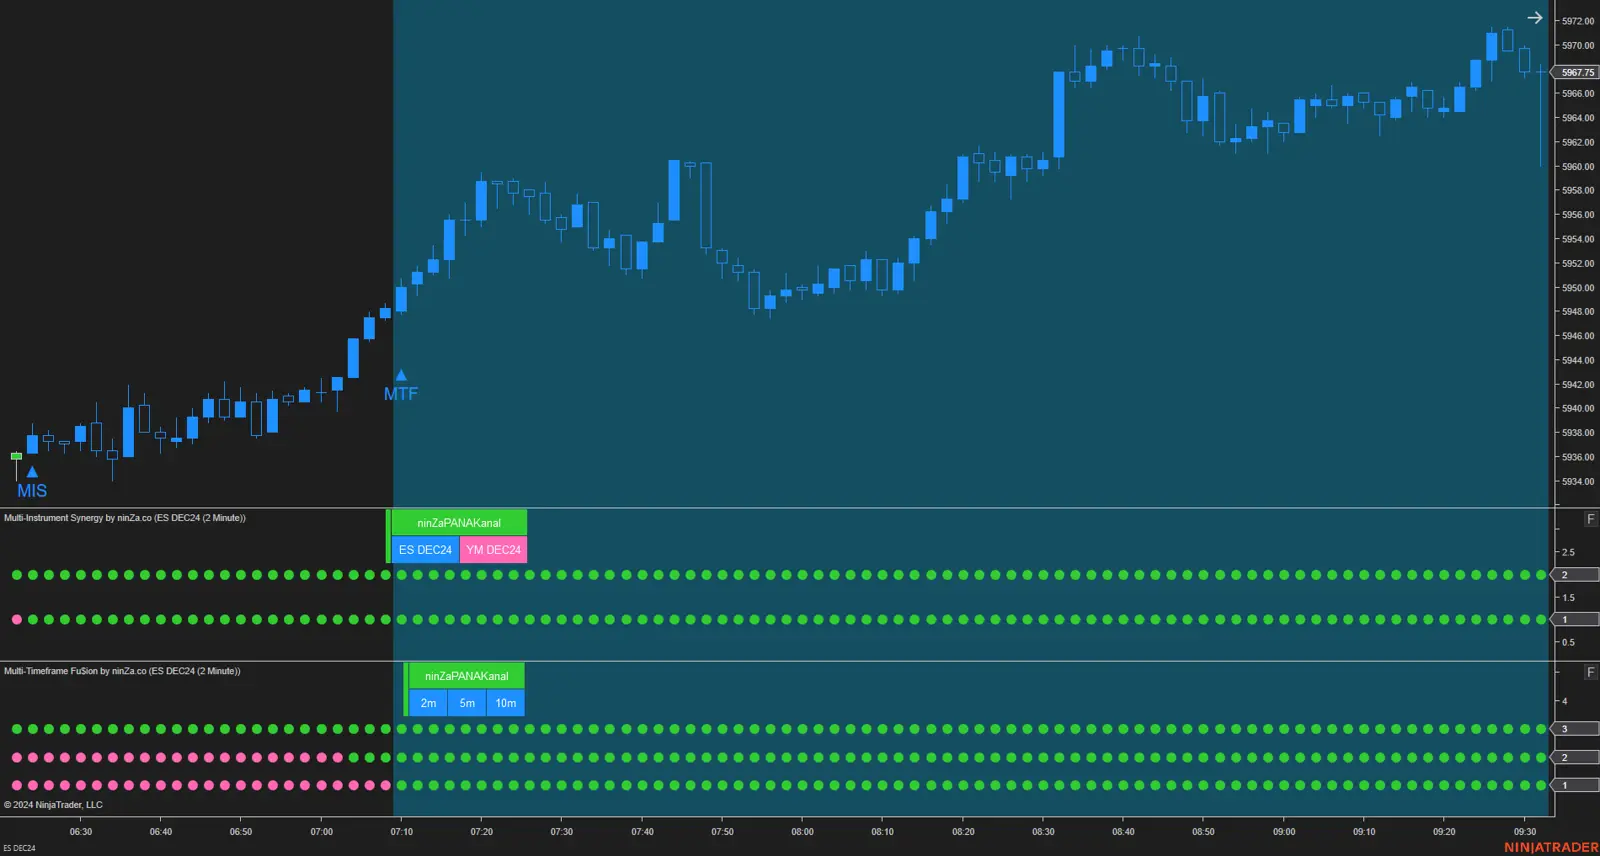
Built on inputs from PANA Kanal, this tool aggregates signals across 5 timeframes. It is ideal for implementing Method 2 – Multi-timeframe confirmation, giving you a visual overview of trend alignment across short and long-term charts.
🔹 Multi-Instrument Synergy
This indicator helps you quickly evaluate positive or negative correlations between markets (e.g., NQ, ES, YM, GC...), enabling you to apply Method 3 – multi-instrument analysis with confidence and clarity.
🧩 When products work together – you trade with full context
Multi-Osc OB/OS Overlap pinpoints reliable signals where technical indicators align.
PANA Kanal defines the market environment and highlights critical price zones.
Multi-Timeframe Fu$ion confirms alignment across multiple timeframes.
Multi-Instrument Synergy verifies whether broader markets are in agreement or divergence.

When all four indicators support your analysis on a single chart, you’re not just seeing a signal — you’re understanding the full logic behind it. That’s how you elevate your trading decisions with higher precision and confidence.
✨ If you're interested in the Alpha Wolf Trading package and Multi-Osc OB/OS Overlap, you can get them both for just $656 (total value $2,590).
➡️ https://ninza.co/checkout?product=1310&coupon=ALMU
P.S. This offer is available until June 30, 2025.