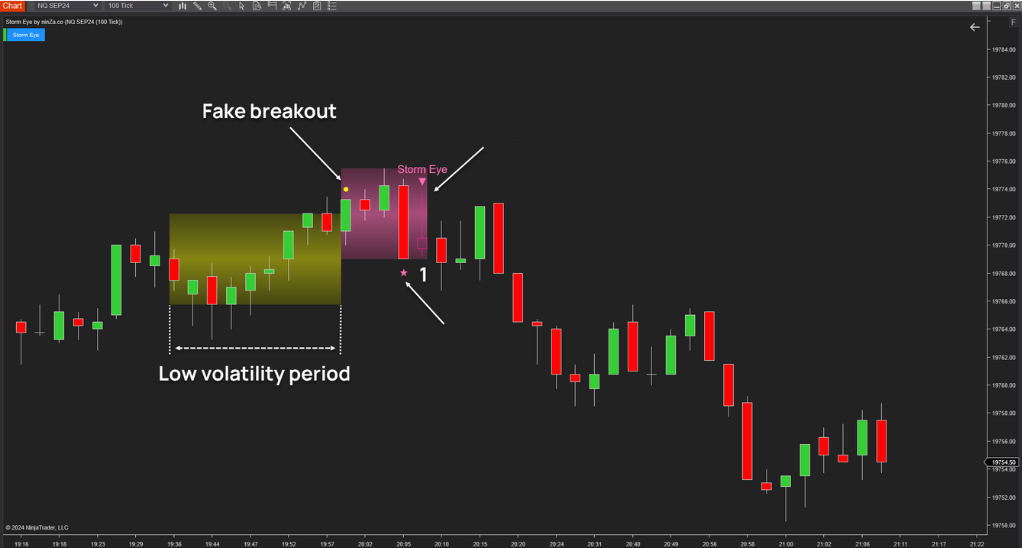
Breakouts are one of the most powerful trading signals. When executed correctly, a breakout trade can deliver high profits in a relatively short amount of time. However, many traders hesitate to trade breakouts due to one frustrating reason: fake breakouts.
So, how do we separate the real opportunities from the traps?
In this article, we’ll break down what a breakout is, what a fake breakout looks like, and how you can improve your ability to spot trustworthy breakout setups using volume, trend context, and more.
What is a breakout?
A breakout happens when the price moves above a resistance level or below a support level — usually after a period of consolidation. Many traders view this as a strong signal that the market is ready to start a new trend.
Breakouts often lead to rapid price movement, making them attractive setups for active traders.

What is a fake breakout?
A fake breakout (or false breakout) occurs when price appears to break a key level (support or resistance) but quickly reverses direction. This can trap traders who entered expecting a strong continuation, leading to quick losses.
This is why many traders hesitate to trade breakouts — they’ve experienced breakouts that don’t follow through.

When are breakouts most effective?
Breakouts are most effective during sideways markets.
A sideways market (also known as a range-bound market) is when price moves within a horizontal range — bouncing between support and resistance — without a clear trend. In these conditions, a breakout above or below the range can signal the start of a new trend, especially when confirmed by other factors.
But even in sideways markets, fake breakouts can occur. So, how do we reduce the risk of getting trapped?
1. Confirm breakouts with volume
One of the oldest and most effective techniques is to look at volume. When price breaks above resistance, that breakout becomes more reliable if the breakout candle is accompanied by strong volume.
However, it’s not enough to look at volume only during the breakout candle. A common mistake is ignoring the volume behavior before the breakout.
Here’s what to look for:
- Before a bullish breakout, look for declining volume on the red candles leading up to the breakout. This signals that selling pressure is weakening — sellers are exhausted.
- If this happens near a significant support or demand zone, it strengthens the case that buyers are preparing to take control.
In short, a real breakout is often preceded by weak selling and confirmed by a burst of strong buying volume.
2. Consider the broader trend
Another way to filter breakouts is by analyzing the trend context.
In an uptrend, price often pauses to consolidate — a process known as accumulation. This is when large players (institutions or professional traders) are quietly buying before pushing the price higher. If you don’t recognize the trend, you might confuse accumulation with distribution (where price stalls before reversing downward).
Key takeaway: In a healthy uptrend, breakouts from consolidation zones are more likely to be real, especially when supported by volume.
That’s why understanding the market trend helps traders judge whether a breakout is a continuation or a trap.
3. A Note from William J. O'Neil
A valuable insight comes from William J. O'Neil in his book “How to Make Money in Stocks.” He highlights a strategy based on identifying stocks that break out of strong base patterns and reach new all-time highs.
According to O’Neil:
"These breakouts are often among the strongest buy signals, with a target return of 20–25% or more."
This is especially relevant in bull markets, where breakout traders can ride the wave of strong momentum and increasing investor interest.
If you're looking for indicators to help you identify breakouts more effectively, consider checking out Breakout Hunter, Storm Eye, and Darvas Pro Max.