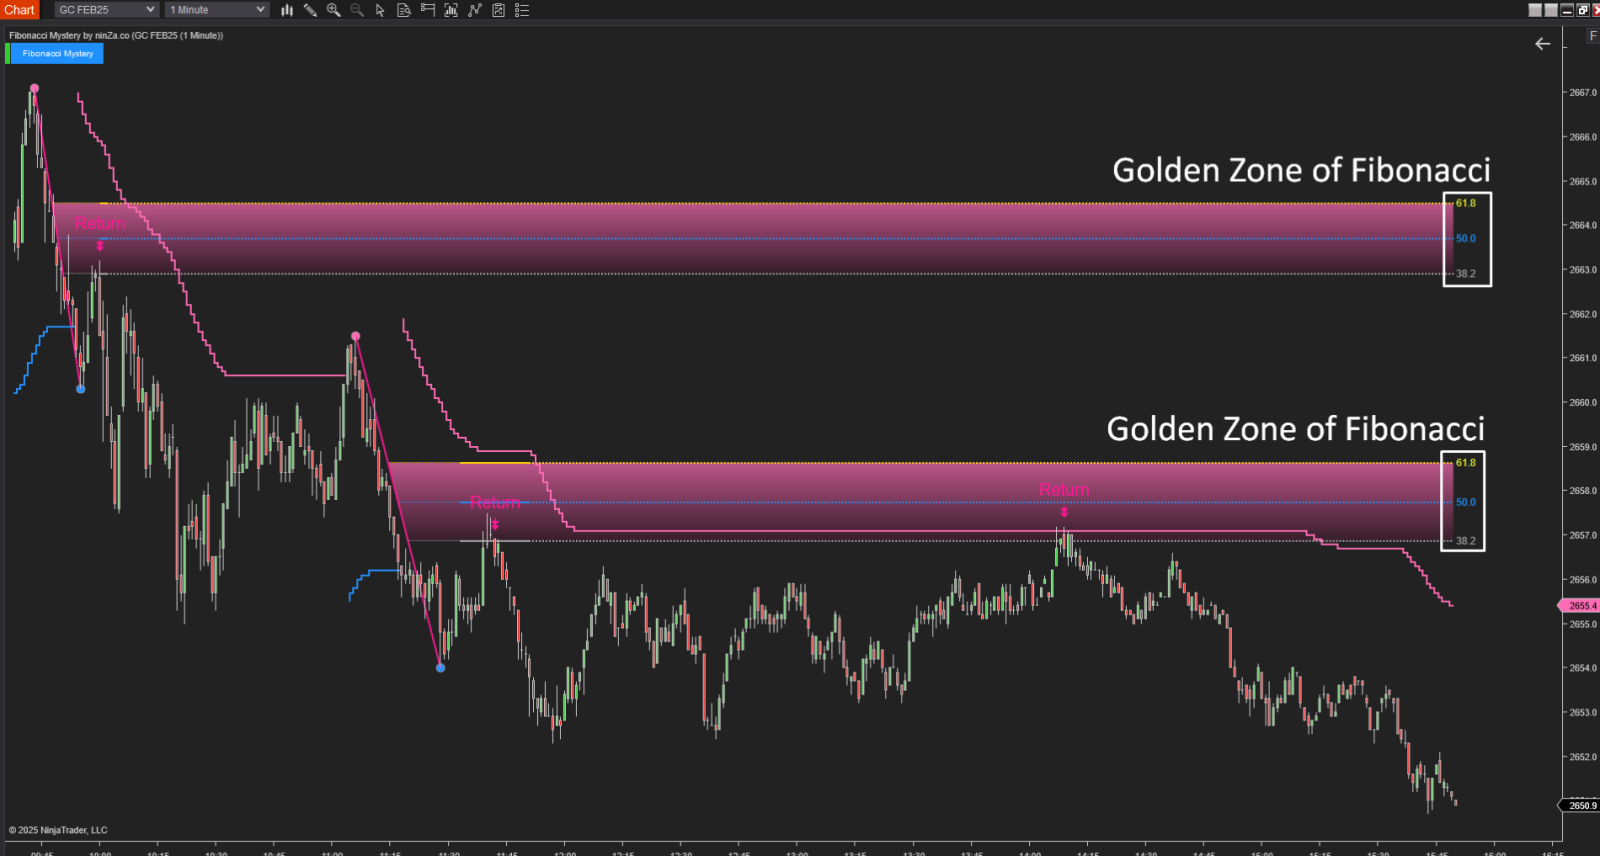
When price moves up or down sharply, it rarely goes straight—it often retraces part of that move. Fibonacci retracement is a technical analysis tool that helps pinpoint price levels where the market might pull back or adjust before continuing the main trend, thus offering optimal entry or exit points.
🔍 Why are Fibonacci retracements important?
- It acts as a potential support and resistance zone, helping traders pinpoint areas where the price is likely to react..
- It reflects a balance between technical and market psychology, since many traders and institutions are watching these levels..
- Fibonacci levels are based on natural mathematical ratios (which appear in nature, art, biology…), making them a trusted and widely used tool in technical analysis..
🔍 The question is: how do you identify reliable Fibonacci Retracement zones?
Here are 2 effective methods:
✅ 1. Precisely identify swing highs and lows in the trend (Structure‑based Fib)
To draw reliable Fibonacci retracements, it’s wise to define the key price swings.
- If you’re looking for buy signals, draw Fib retracement levels from the swing low to the swing high.
- If you’re looking for sell signals, draw Fib retracement levels from the swing high to the swing low.
This is exactly how the Fibonacci Mystery indicator works:
- Step 1: Identify the highest peak
In an uptrend, mark the strongest swing high as 100%, and vice versa.
- Step 2: Identify the first swing low
When the trend reverses, mark the first swing low as 0%.
- Step 3: Generate return signals
The indicator issues trade signals when price retraces to key Fibonacci levels (e.g., 38.2%, 50%, 61.8%).

Result: By mapping out key swing points, Fibonacci Mystery can catch reversal signals and help you trade both in trending markets and in sideways conditions.

Why is this method reliable?
Because in real trading:
- The previous swing low marks a strong buying zone; it’s the point where buyers entered with enough strength to reverse a downtrend into an uptrend.
- The first swing high in the new uptrend indicates the return of selling pressure - it's the first point where sellers push back.
So the question is:
→ How far will the price pull back before one side gives up?
→ Where will the market likely pause or reverse?
Most of the time, the answer lies at key Fibonacci Retracement levels.
That’s why we use Fib retracement — to catch pullbacks and capture retracement signals with precision for good entries in a trend.
✅ 2. Follow the trend structure and ride the market flow
Another effective method is using Fib to measure pullbacks within a clear trend:
- In an uptrend: higher highs and higher lows → draw bullish Fib from the low to the high to capture buy entries during retracements.
- In a downtrend: lower highs and lower lows → draw bearish Fib from the high to the low to find sell entries during pullbacks.
Why does this work?
Because in any trend, the price will always go through many corrections.
In a trend, price often pulls back to around the 38.2% to 61.8% levels, then continues in the trend direction. From these pullbacks, traders can already catch several good entries.
This is the approach used by the Zephyrus Force system:
- It helps traders capitalize on smaller corrections within a large trend.
- This way is especially ideal for scalpers or intraday traders who take multiple trades per day.

🎯 Conclusion
Fibonacci Retracement isn’t just a theory used by a few traders; it’s trusted by hundreds of thousands around the world. It’s even believed that: “Fibonacci levels are considered a self-fulfilling prophecy…”
That’s why you can feel confident applying this method. It’s grounded in logic and widely respected in the trading community!
In this guide, we shared 2 practical ways to find reliable Fibonacci Retracement zones. Both methods work — the best one depends on your style of trading.