How to gain a true understanding of price action?
If you're a price action trader, this is the core question in your journey to building an edge in the market.
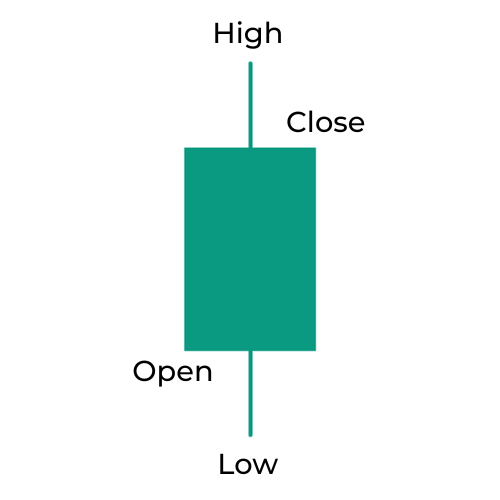
To truly understand price action, you must be able to see the actual trajectory of price movement inside each candlestick — something that traditional chart types like candlesticks, bar charts, Renko, or Heiken Ashi simply cannot show. These candles only display four price points: Open, High, Low, and Close (OHLC), but they hide the entire path price took to reach those values.
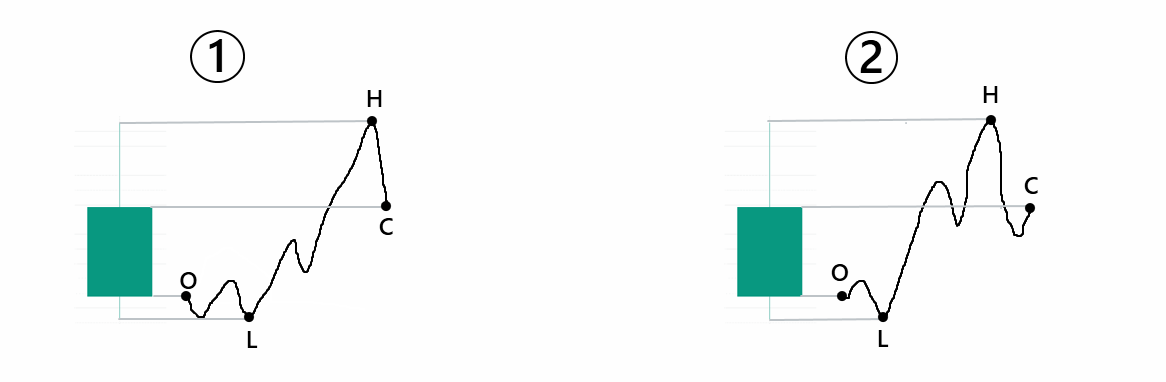
For example, 2 bullish candles with identical OHLC values might have been formed by completely different price paths. One might show a sharp rally after forming a double bottom, while another could be a slow, choppy rise. Same candle shape, but two entirely different stories. Without seeing what really happened inside the candle, your analysis remains surface-level and lacks true depth.
TickData Microscope – A microscope for every candle
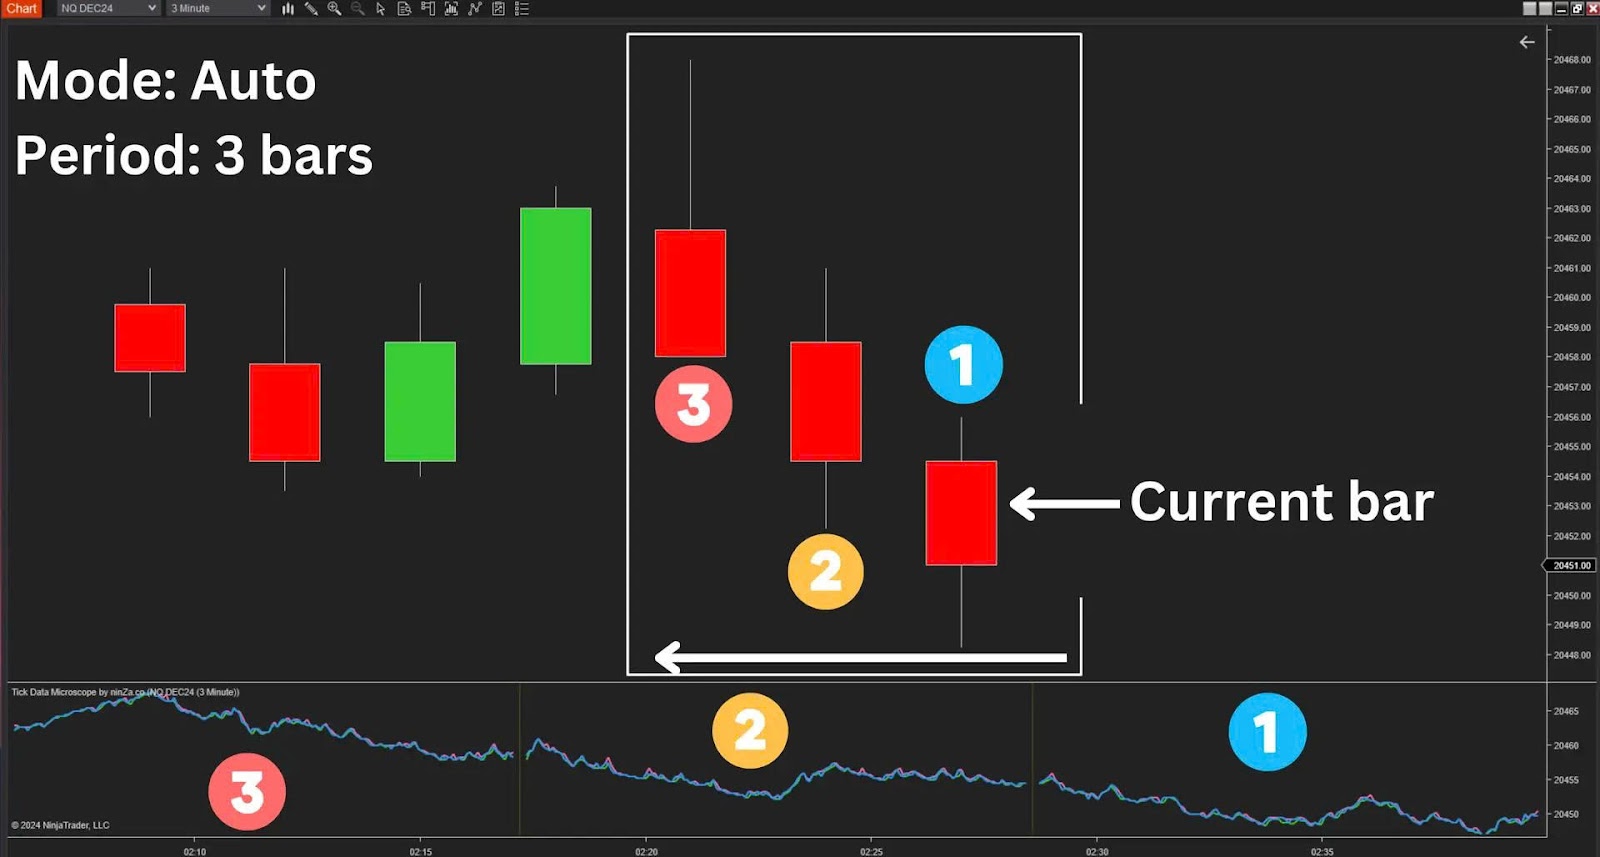
This is where TickData Microscope comes in. This indicator allows you to zoom into each candlestick and view every movement of price — down to each tick, second, minute, range, or volume. It acts like a microscope that reveals what’s happening inside any candle or group of candles you choose to examine.
You can analyze data manually (by selecting specific candles) or automatically (by setting it to display the most recent candles based on your preferences). Just make sure the analysis timeframe is lower than the timeframe of the candle you're analyzing — for example, to study the internal price movement within a 1-minute candle, use a tick, 1-second, or similar lower timeframe chart. This ensures you're zooming in on the finer details that formed the higher-timeframe candle.
What can TickData Microscope do for you?
Reveal the real price action within each candle: You can clearly see how price moved within the candle — something no traditional chart tool provides. This helps traders better understand real-time market behavior.
Identify strong entry and exit points earlier: By spotting internal patterns (e.g., double bottom, triple bottom, head and shoulders), you gain earlier confirmation for more confident decisions.
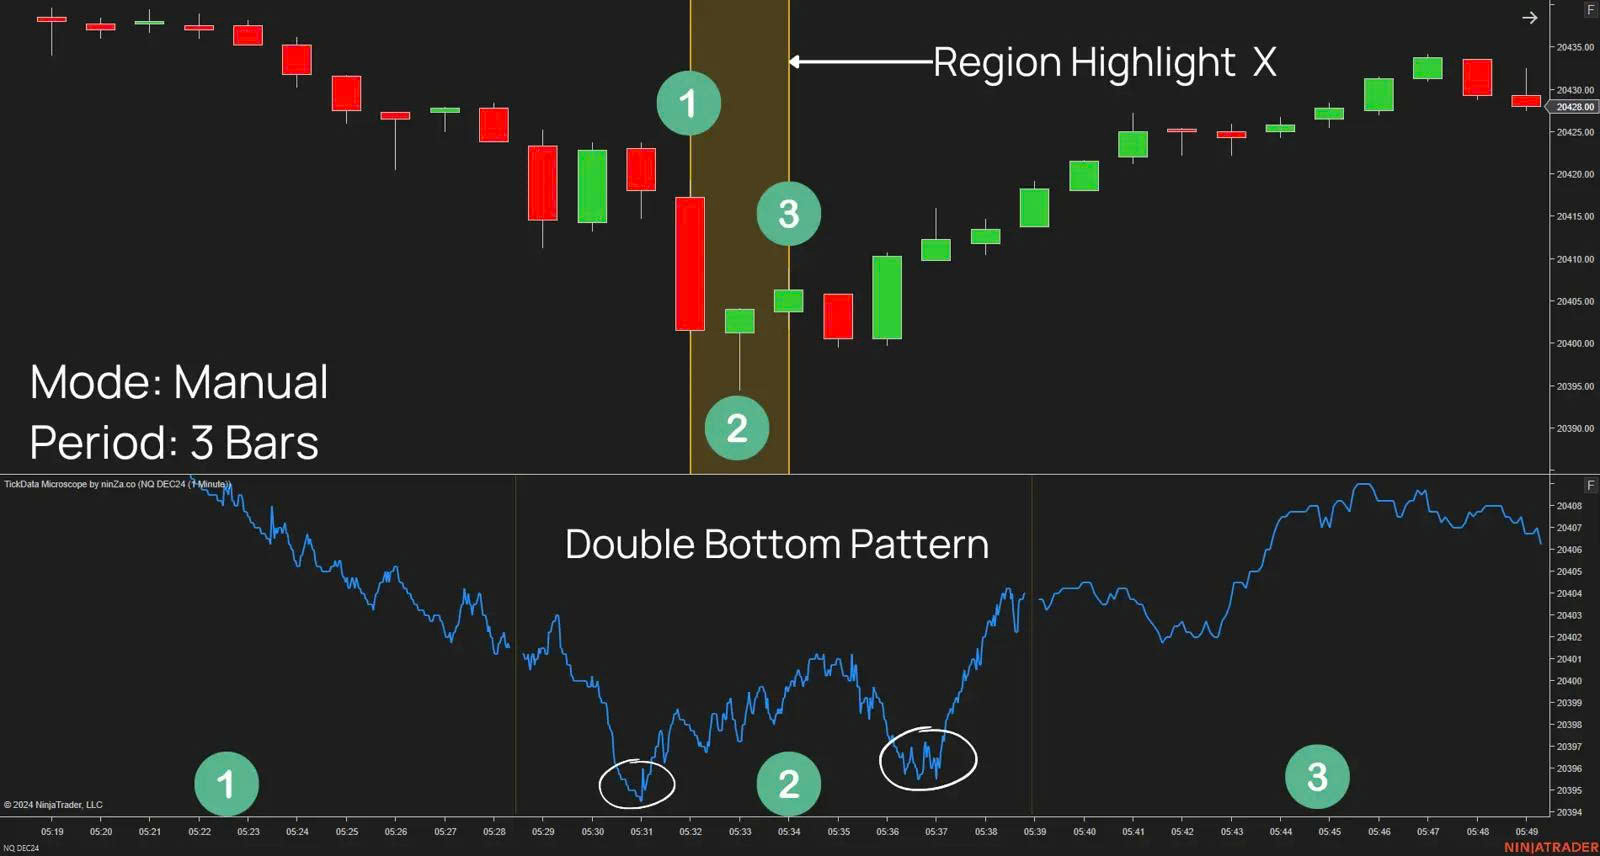
Boost the credibility of signal candles: A bullish candle with an accumulation pattern inside (like a double bottom) has a higher chance of continuation. A bearish candle with a distribution pattern (like a double or triple top) offers stronger confirmation for short setups.
Uncover hidden support and resistance zones: By observing detailed internal price movement, you can detect price gaps and imbalance zones that are invisible on traditional charts.
Support for price action and scalping strategies: TickData Microscope is ideal for traders who rely on high dependability and fast decision-making.
Enhance the consistency of other indicators: Combine it with your favorite technical indicators to increase signal strength and confirmation.
Build versatile trading strategies: With a high-resolution view of price movement inside each candle, you can develop strategies tailored to different market conditions.

Conclusion
TickData Microscope isn’t just an indicator to “zoom in on candles” — it’s a powerful upgrade for how you understand price action. When you can clearly see the true path of price, your analysis becomes sharper, and your decisions more confident and well-grounded.
If you’re excited about this product, click the link below to get TickData Microscope for just $326 — plus receive a perfectly paired bonus gift (VoluTank Army valued at $800) completely Free.
💎 https://ninza.co/checkout?product=1348&coupon=TIVO