In the world of financial trading, volume is considered one of the most critical elements for assessing the true strength behind price movements. Especially for price action traders, volume isn’t just supporting data — it’s a core decision-making tool.
What makes volume so valuable is that it reflects real money flow — something no technical indicator can fully replicate. But volume today is no longer limited to just the basic bar chart showing total traded quantity. As trading technology has advanced, many variants of volume analysis have emerged, giving traders deeper insights into market psychology and institutional behavior.
Let’s explore the most important volume variants — and how you can take advantage of them effectively.
1. Volume Delta – Gauge buying & selling pressure in each bar
Traditional volume tells you how much was traded in a candle, but not who was more aggressive: buyers or sellers. Volume Delta fills that gap by showing the difference between buying and selling volume in each bar — revealing which side is dominating.
For example, if you see a green candle but it has a negative volume delta, that’s a potential warning sign. Buyers may have pushed price up, but sellers were still in control. On the other hand, a green candle with strong positive delta confirms that buyers truly dominated that move—making it a far more trustworthy signal.
💡 Your solution: Volume Delta Indicator for NinjaTrader 8
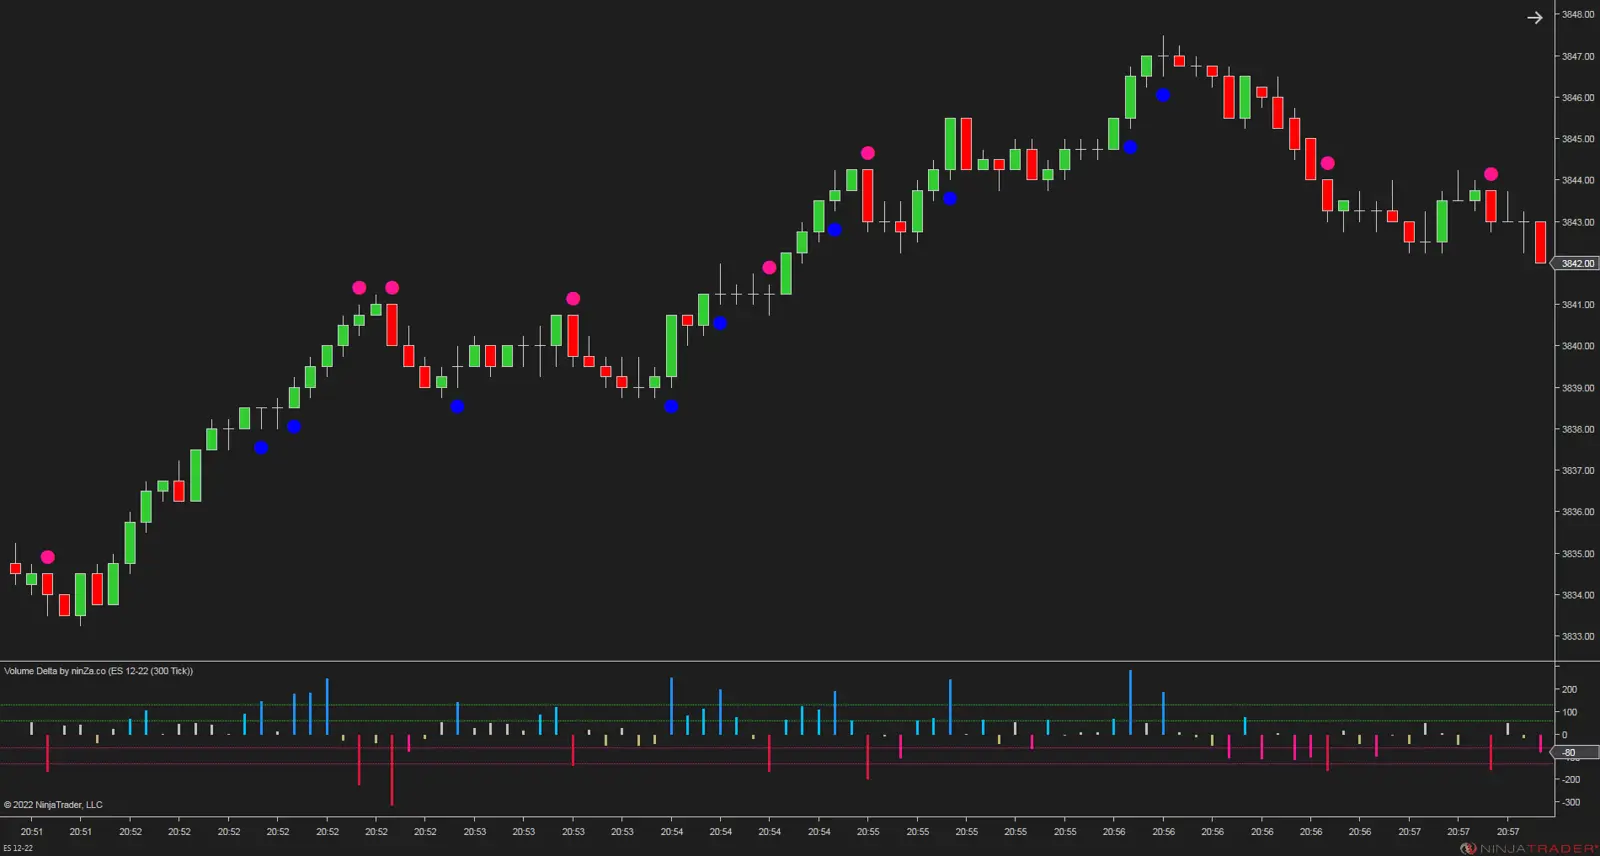
This indicator not only displays buy vs. sell volume differences, but also lets you filter trades by volume size—allowing you to track the footprints of different trader types (e.g., retail traders, pros, banks). On top of that, it includes threshold-based alerts for strong and moderate delta values—so you can catch important turning points in real time.
Note: Use coupon code "VOLUME22" at checkout to secure an EXTRA 22% OFF all the products mentioned in this post — limited time only!
2. Cumulative Delta – Understand trend strength through accumulated volume
While Volume Delta works bar-by-bar, Cumulative Delta goes further by accumulating delta values over time - offering a big-picture view of buying and selling pressure during a trading session. It’s a powerful way to validate the strength and legitimacy of a trend.
For instance, if price is rising and cumulative delta is also rising, that’s a solid confirmation that buying pressure is supporting the move. But if price is rising while cumulative delta is flat or negative—proceed with caution.
💡 Your solution: Cumulative Delta Indicator for NinjaTrader 8
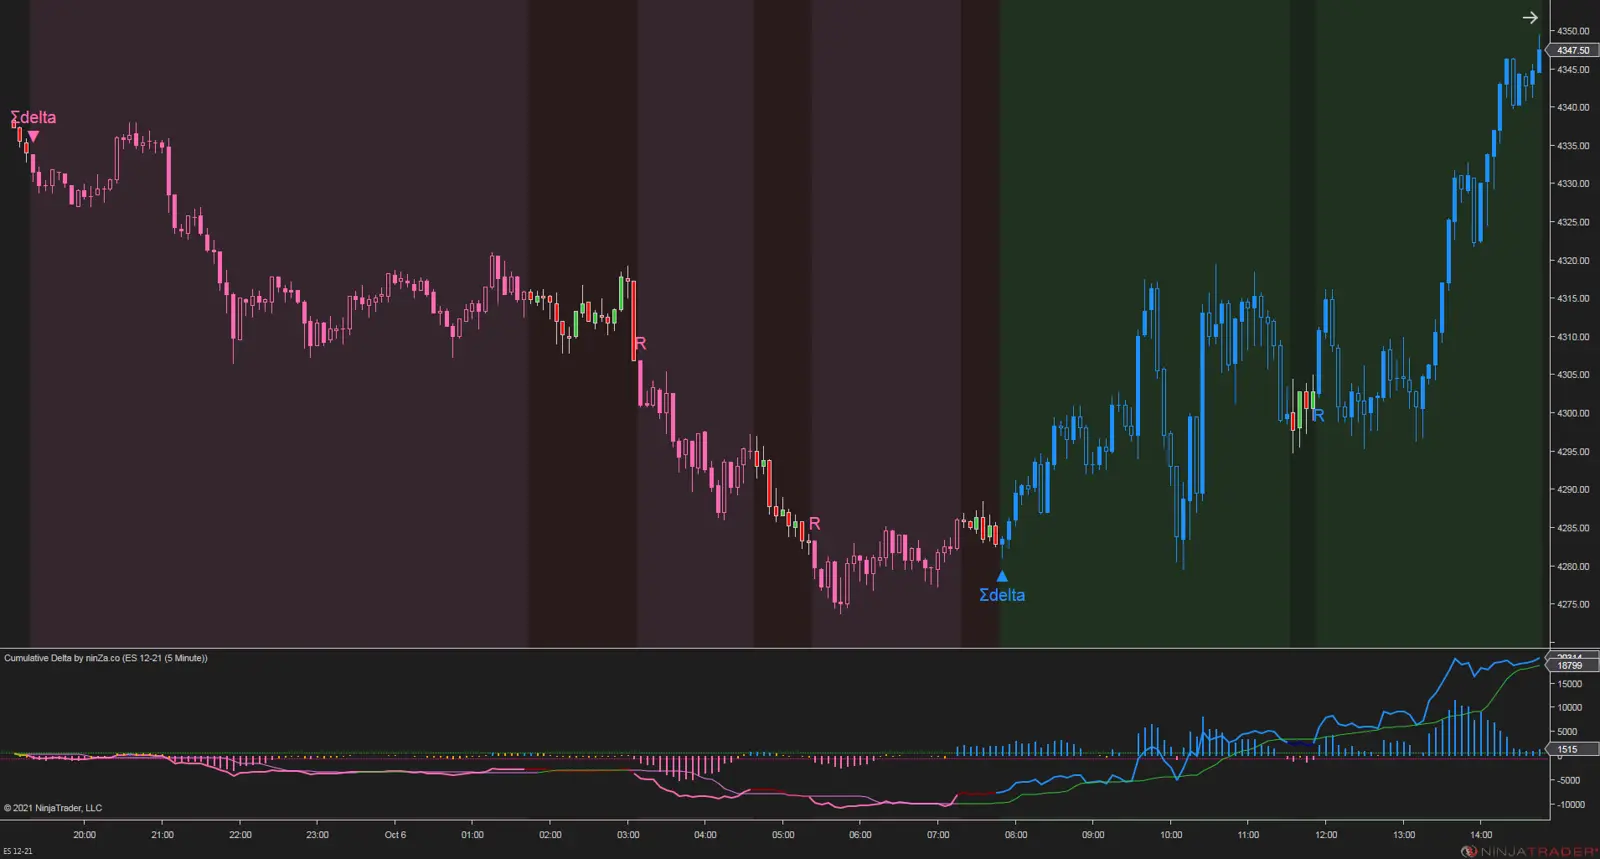
This unique product combines cumulative delta with price action and a dynamic median, offering unmatched accuracy in trend phase identification. Bonus: you can highlight background zones for uptrends and downtrends, filter volume by trader type, and visually confirm when the market is in a strong directional phase.
3. Volume Profile – Discover the most traded price zones
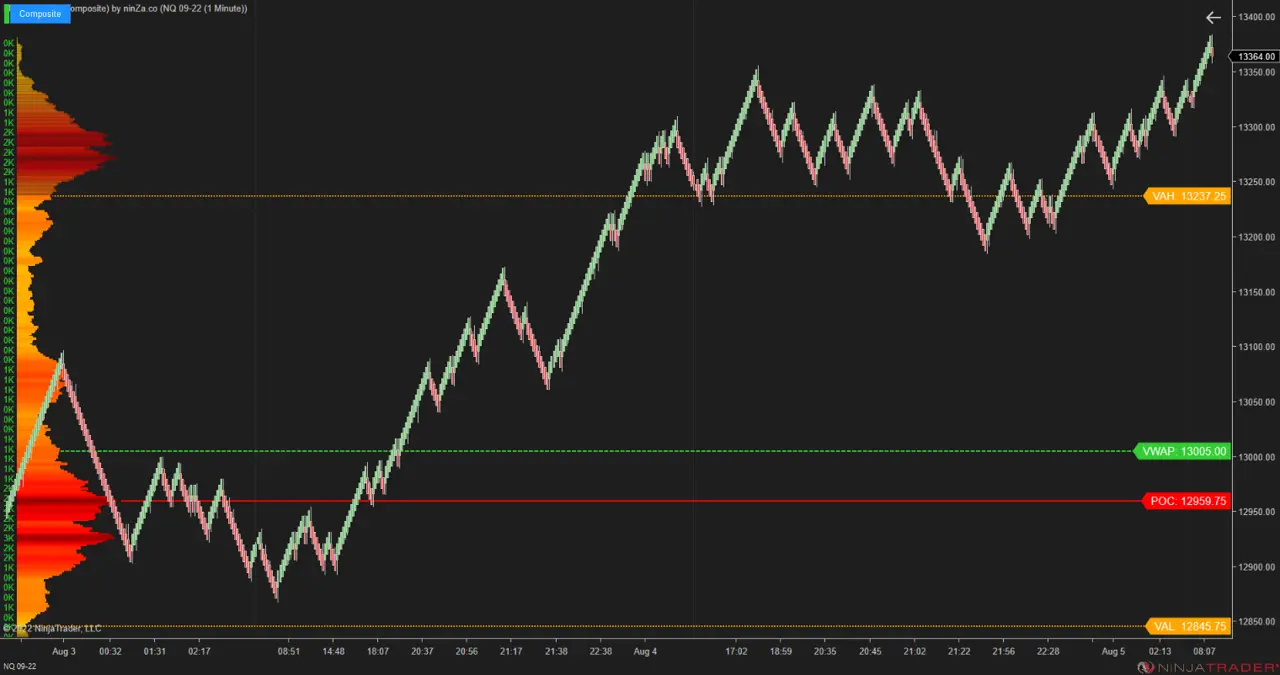
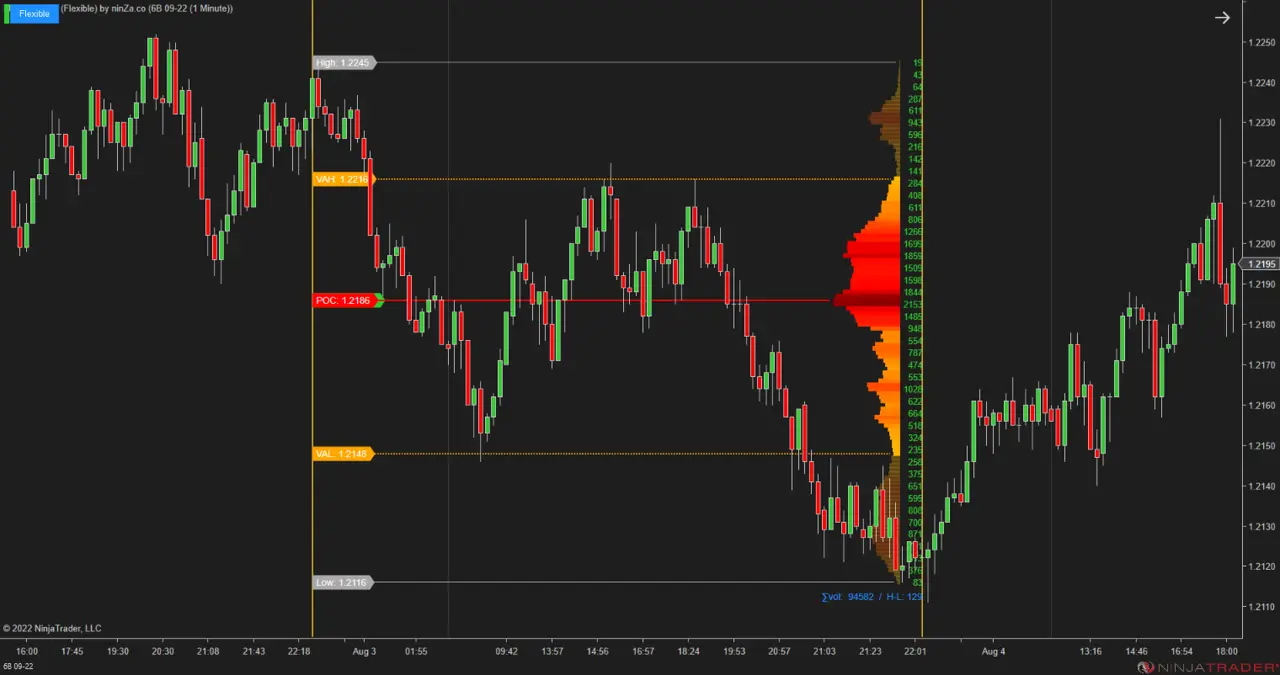
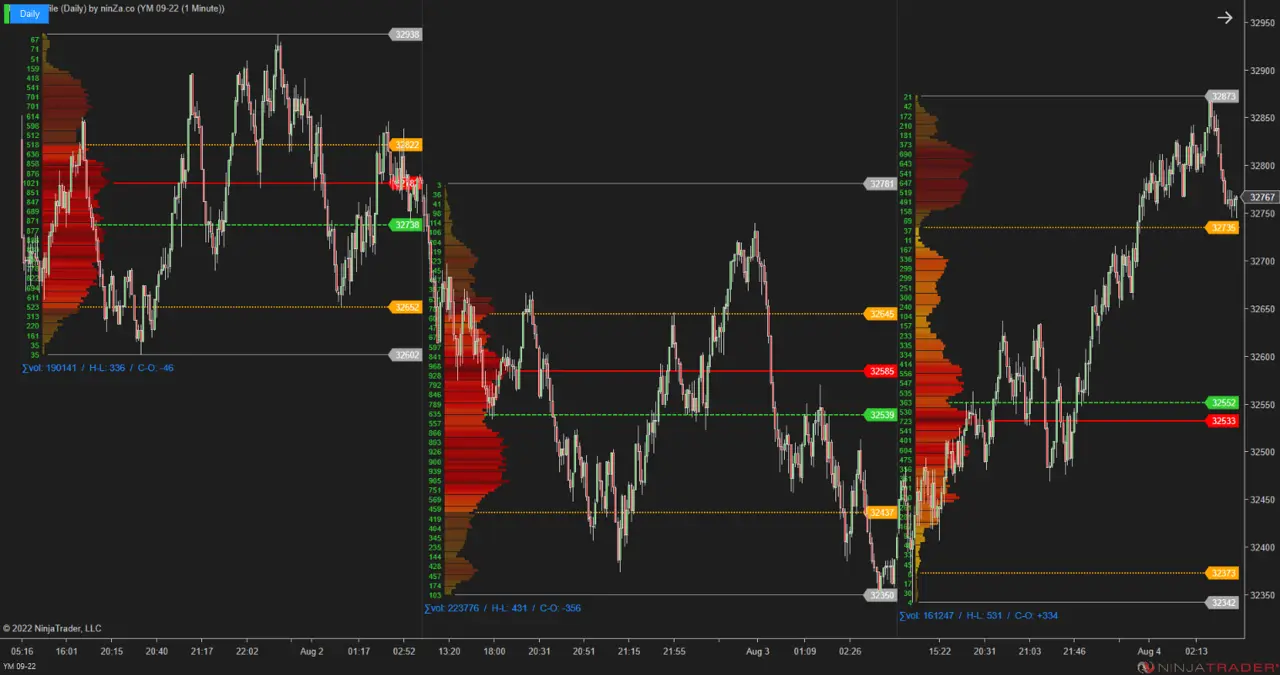
Unlike delta indicators, Volume Profile focuses on volume at price levels, not over time. This makes it an essential tool for identifying price zones where the market shows the most interest—areas where real money is actively trading.
Volume Profile helps traders pinpoint:
Point of Control (POC): The price level with the highest volume.
Value Area: The range where most of the trading occurred.
Key support/resistance zones based on volume concentration.
💡 Your solution: A powerful trio of Volume Profile Indicators for NinjaTrader 8
Note: Use coupon code "VOLUME22" at checkout to secure an EXTRA 22% OFF all the products mentioned in this post — limited time only!
4. Order Flow – Analyze the market from inside each candle
Finally, Order Flow represents the most in-depth level of volume analysis—allowing you to see buy/sell activity at each price level within a candle. This is where the footprint chart becomes a go-to tool for serious traders.
With a footprint chart, you can analyze:
Buy/sell volume at every price
Order imbalances within the bar
Presence of large players or aggressive orders
💡 Your solution: Order Flow Presentation (Footprint Chart) for NinjaTrader 8
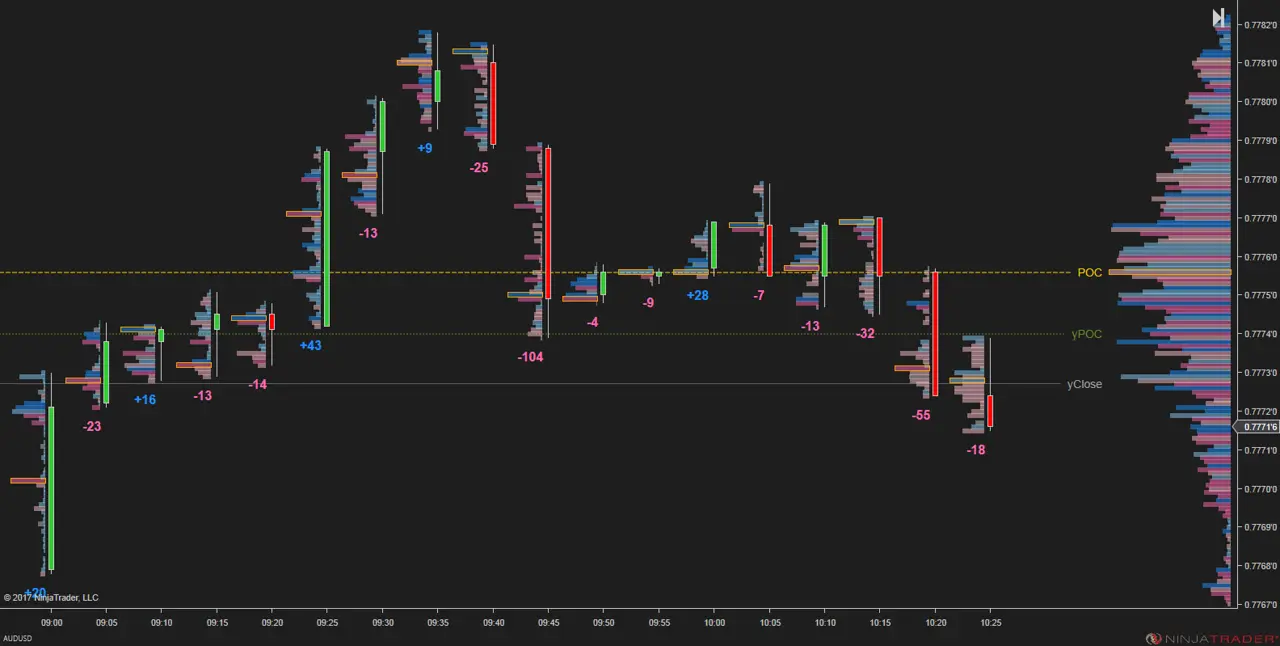
This elegant indicator delivers a clear and customizable footprint chart — revealing who’s in control at each price level. It gives you deep insights into order flow behavior, enabling precise and confident trade decisions. A must-have for traders seeking clarity inside each candle.
Final Thoughts
Volume isn’t just a number — it’s the lifeblood of the market. When you understand and correctly apply modern volume analysis through tools like Volume Delta, Cumulative Delta, Volume Profile, and Order Flow, you move from reacting to the market… to reading its intentions.
Ready to decode the true story behind price movements? Use coupon "VOLUME22" to get an EXTRA 22% OFF any of these advanced volume-based indicators — and sharpen your edge in any market condition.