In technical analysis, few tools are as simple - yet as powerful - as the trendline. While it’s often underestimated, a properly drawn and interpreted trendline can give you high-probability trading signals when combined with price action, volume, and context.
In this post, let’s walk through everything from the basics to advanced strategies - including how to use Trendline Autom@ton to automate multi-timeframe trendline analysis.
1. What Is a Trendline?
A trendline is a straight line that connects rising lows in an uptrend, or falling highs in a downtrend. It helps:
Identify the overall market direction
Act as support/resistance
Confirm the strength or weakness of a trend
Trendlines reflect market psychology, when price respects the trendline, the trend is intact. When it breaks, something may be shifting.
2. How to Draw a Proper Trendline
To make your trendline reliable, follow these principles:
You need at least two touchpoints, ideally three or more
The points should align with the natural structure of price
Keep the slope reasonable - too steep = easily broken; too flat = less meaningful
3. How to Use Trendlines in Trading
Trendline Break + High Volume = Powerful Confirmation
One of the strong signals is when a trendline breaks with a spike in volume:
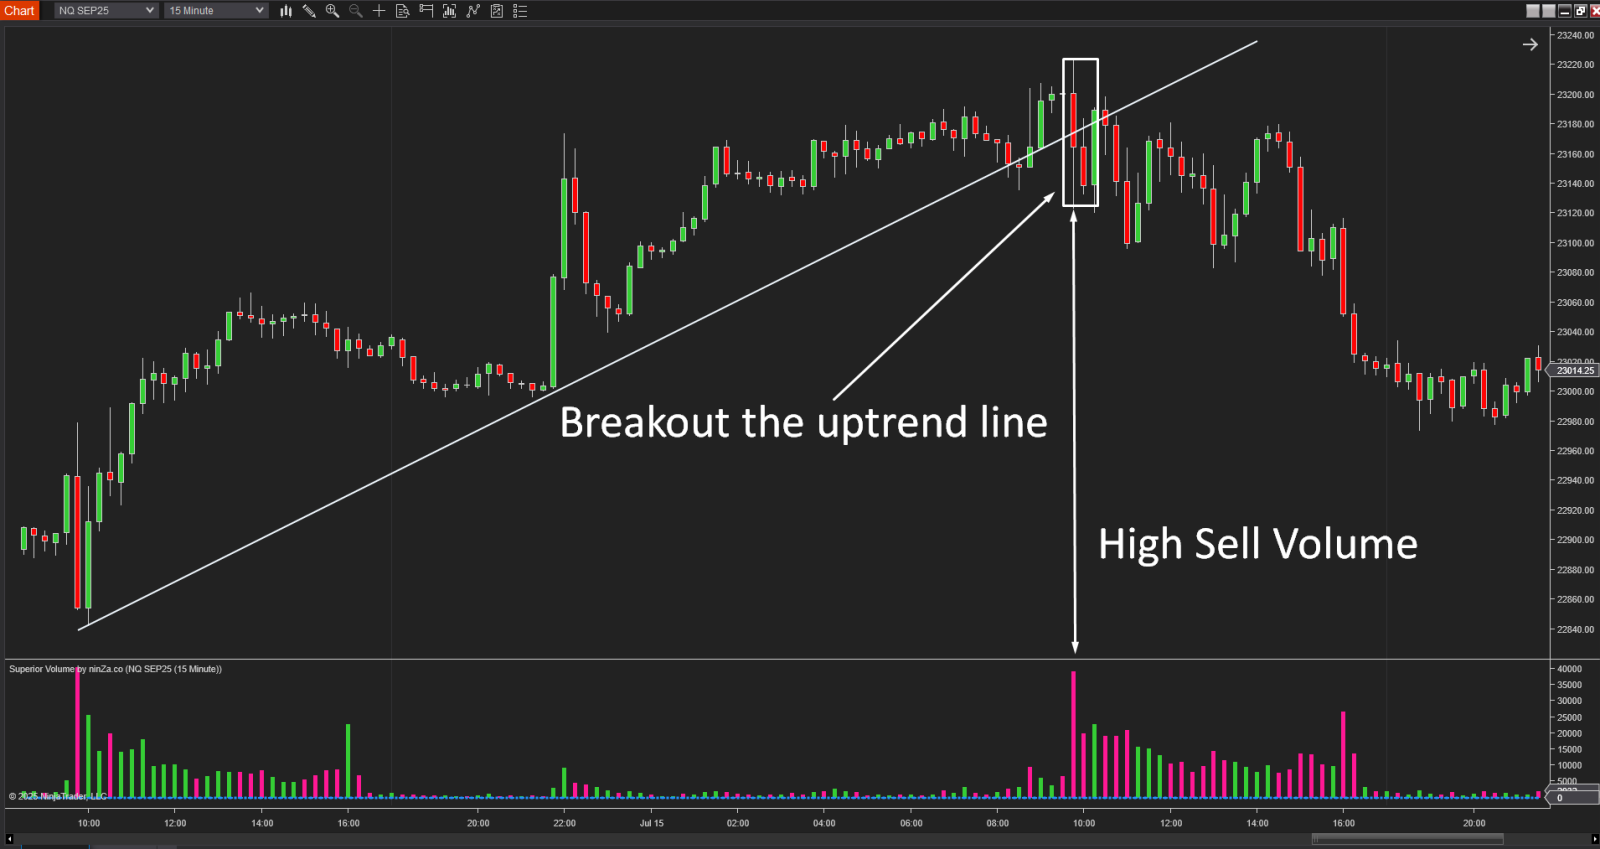
- If an uptrend line breaks with heavy selling volume, it often confirms a bearish shift
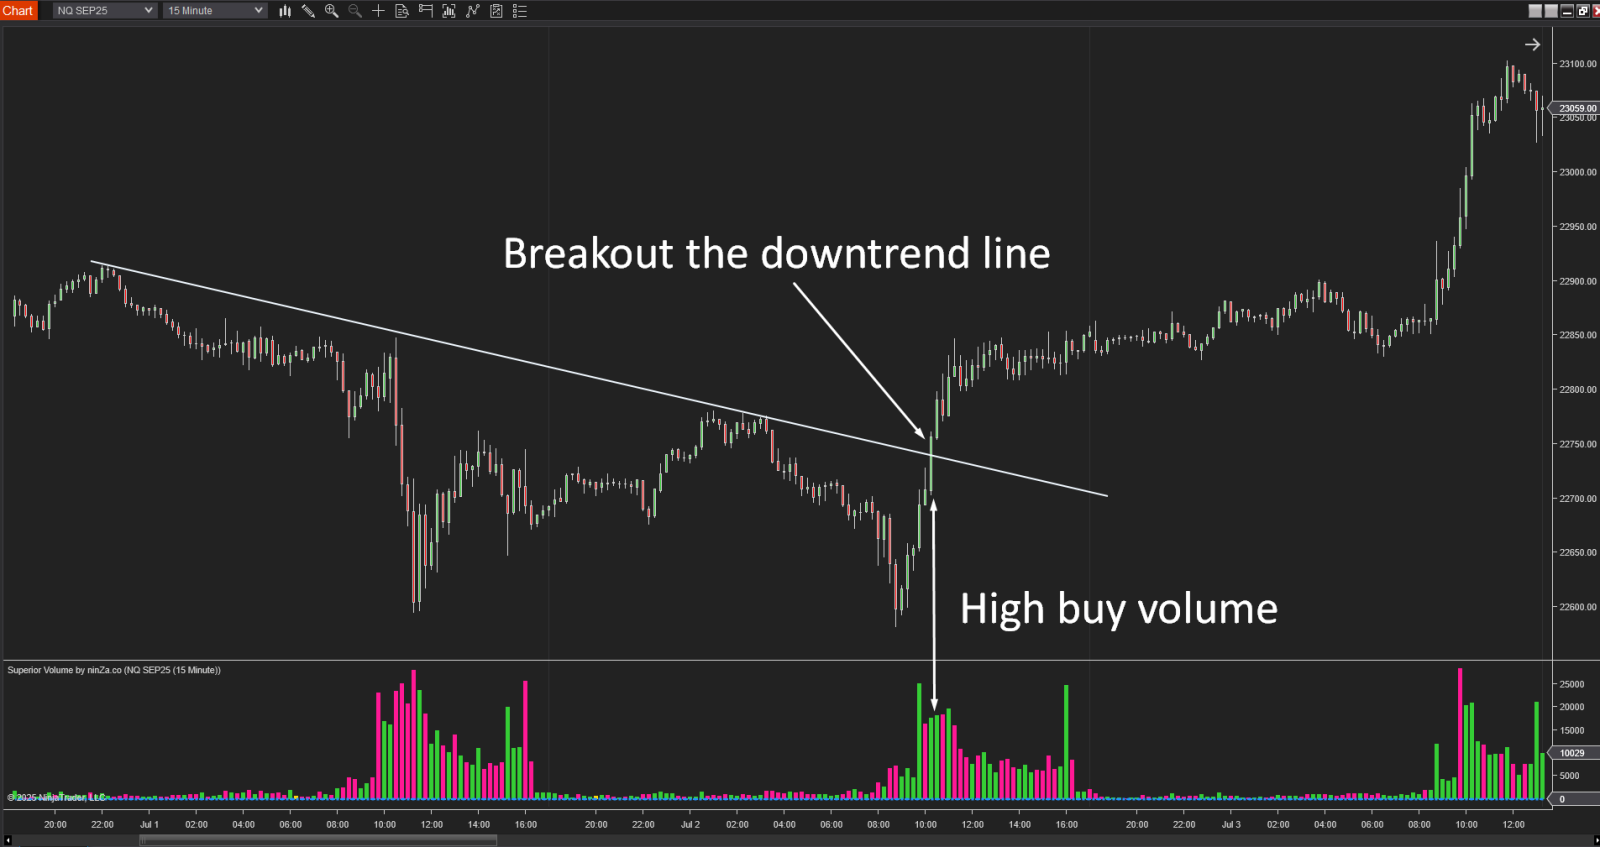
- If a downtrend line breaks with strong buying volume, it suggests a real breakout
🎯 Volume is the footprint of smart money. No volume = no conviction.
Trade With the Trendline and the Trend
Trendlines help you follow the trend, not fight it:
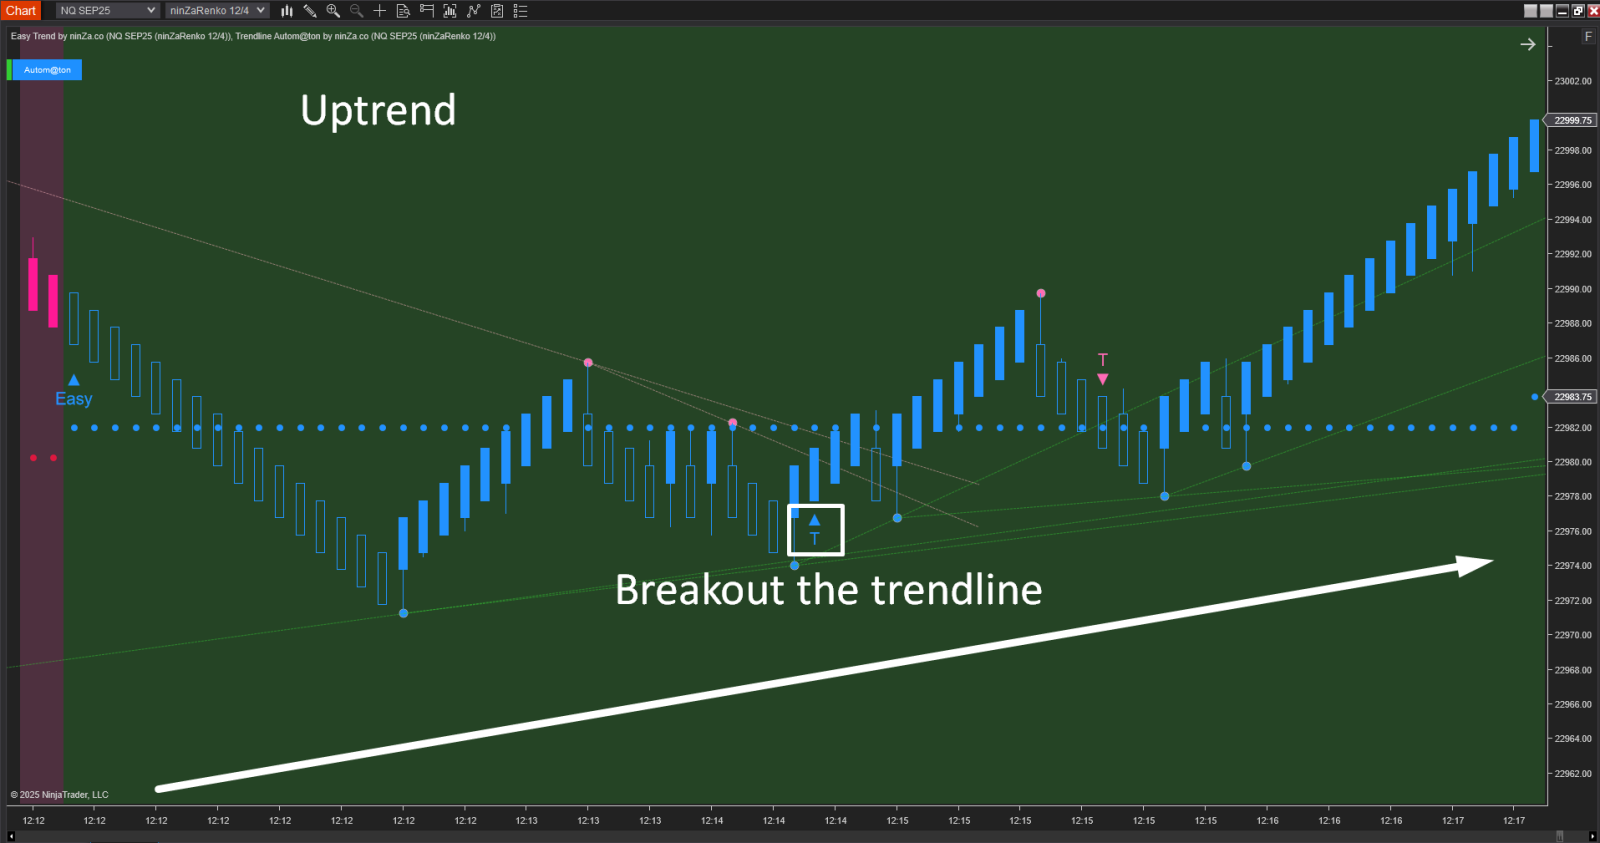
- In an uptrend → draw a trendline along rising lows → look to buy the pullbacks
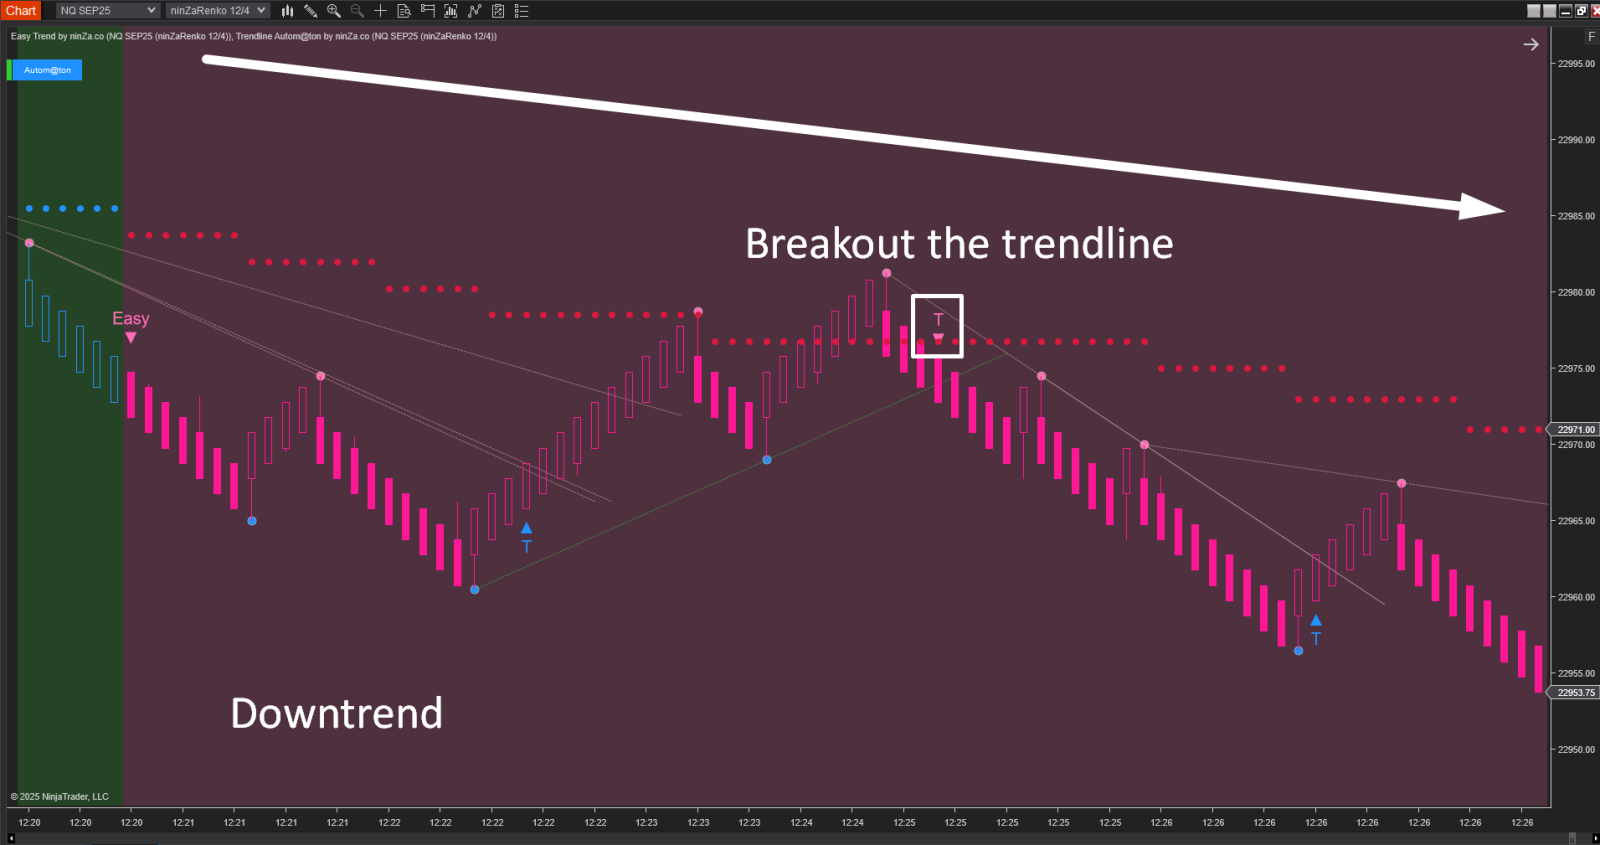
- In a downtrend → draw a line along falling highs → look to sell the rallies
When Price Hits S/R Then Breaks the Trendline = High-Conviction Setup
A powerful setup happens when:
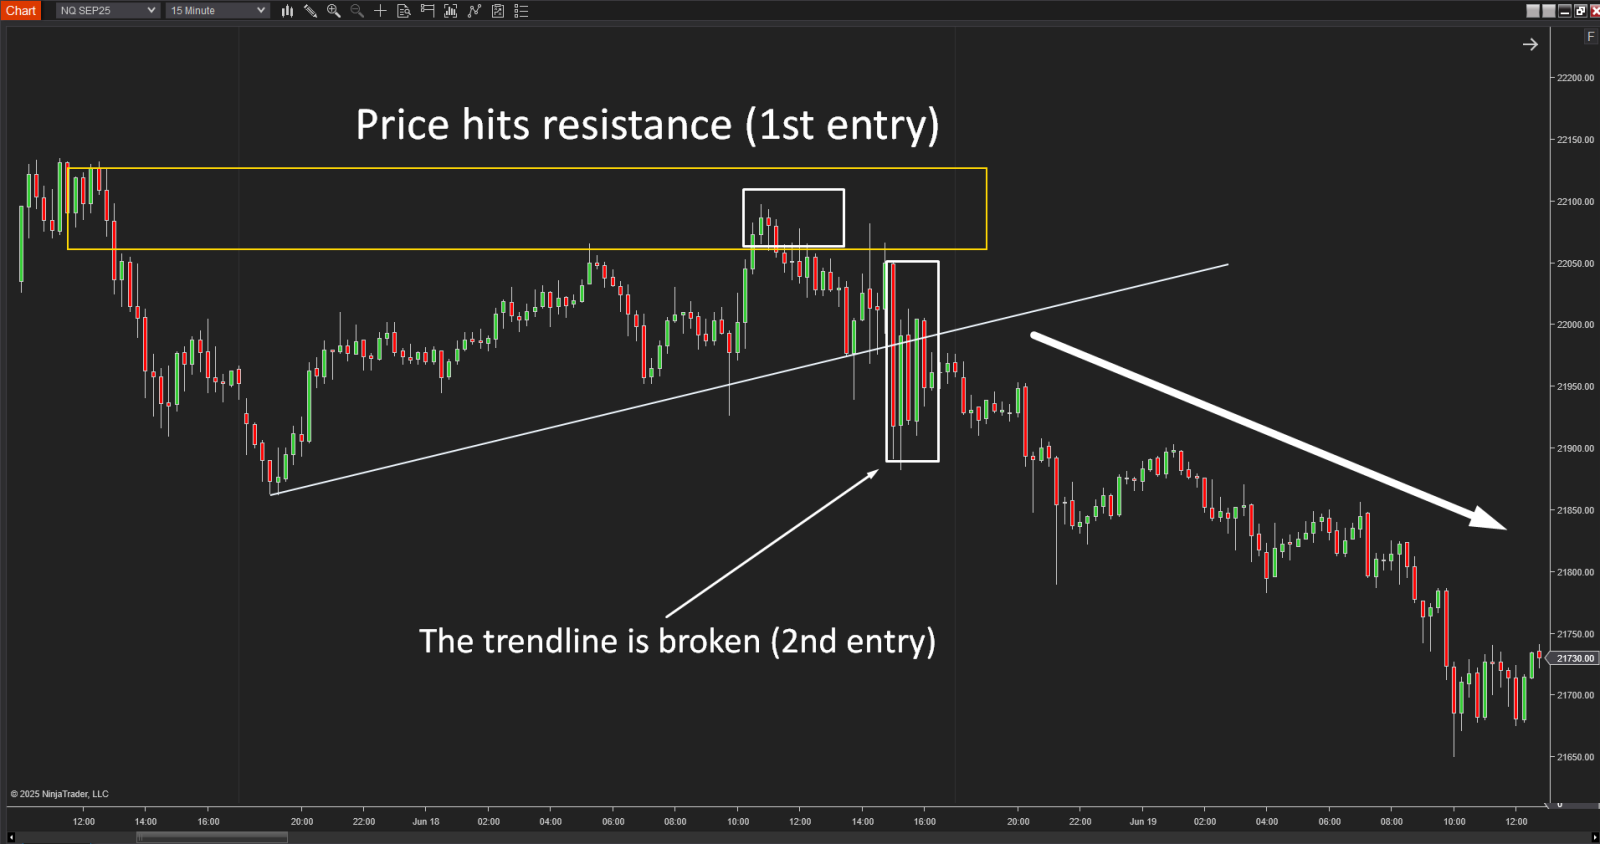
In this case, the trendline becomes a confirmation tool - it shows that the S/R zone was strong enough to trigger a directional shift.
Multi-Timeframe Trendline Strategy Using Trendline Autom@ton
Multi-timeframe analysis is essential for serious traders. But drawing trendlines on every timeframe manually is time-consuming and messy.
Enter: Trendline Autom@ton – an indicator that automatically draws trendlines across different timeframes.
🔹 Key Benefits:
Auto-detects valid trendlines on any timeframe
Lets you see short-, medium-, and long-term trend structure on a single chart
Eliminates guesswork and saves time
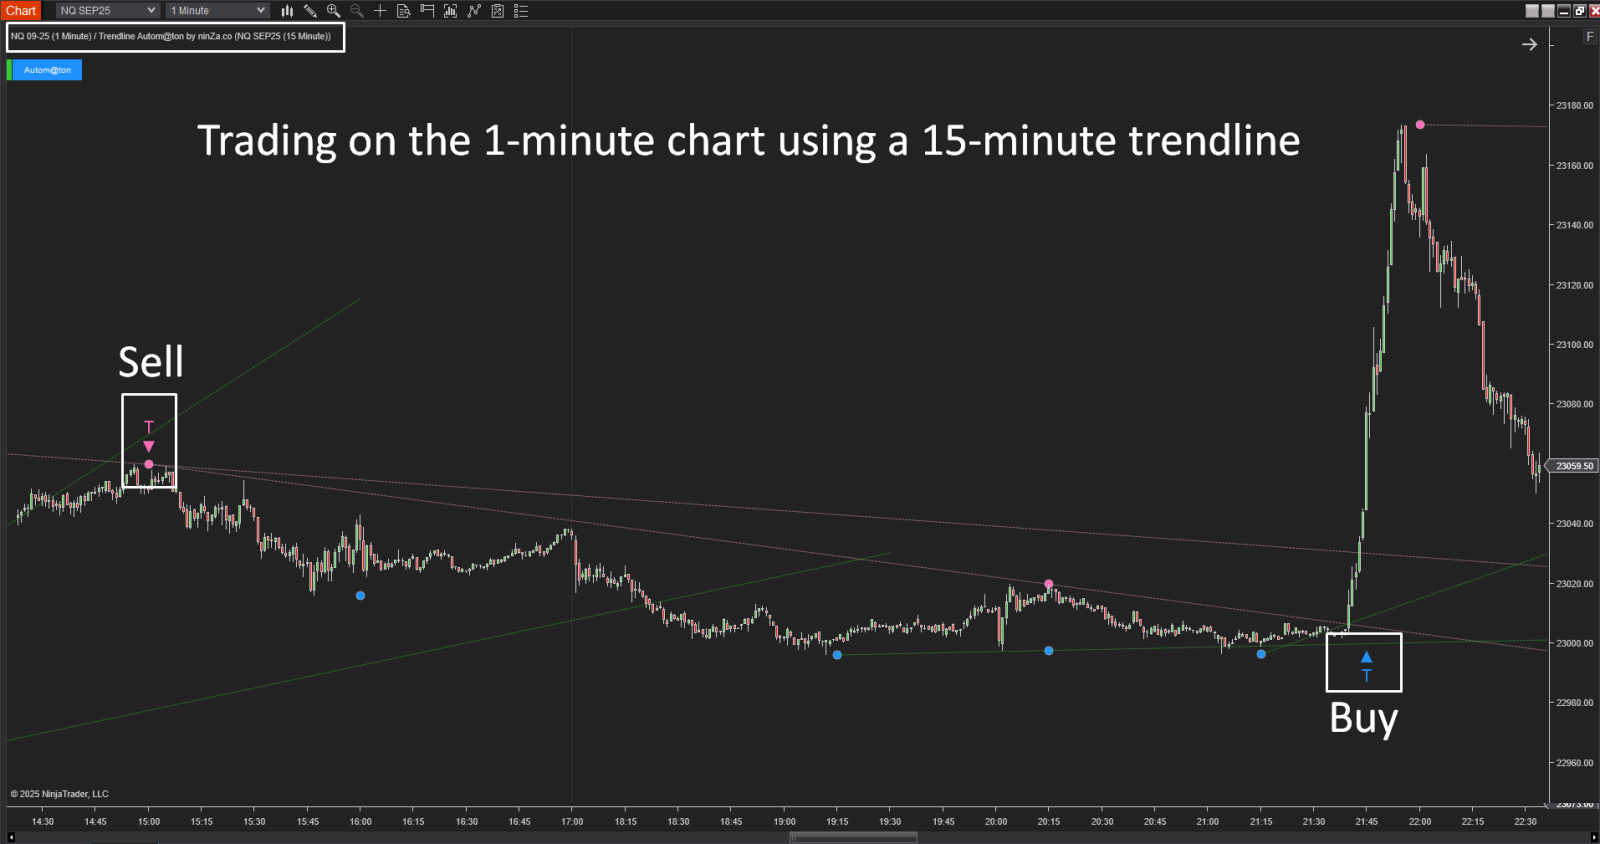
Step-by-step: How to Use Trendline Autom@ton Effectively
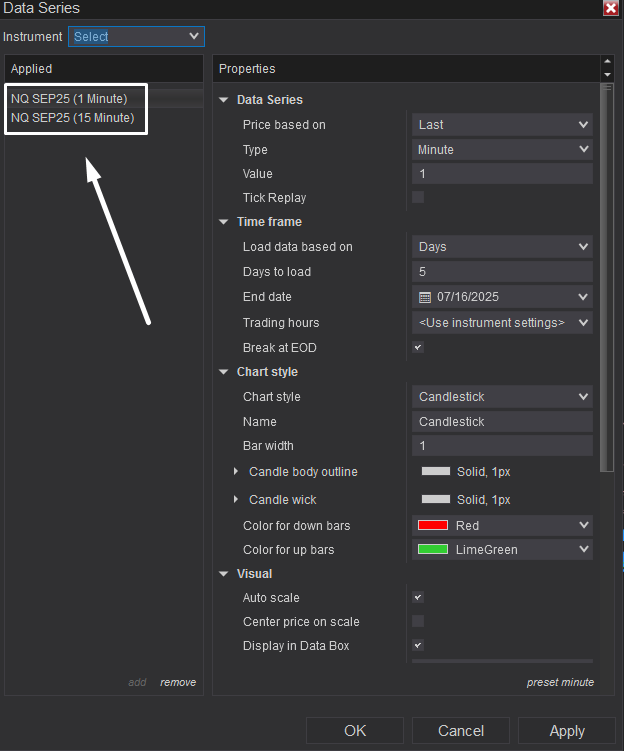
Step 1: Select the timeframe you want to use consistently across the data series.
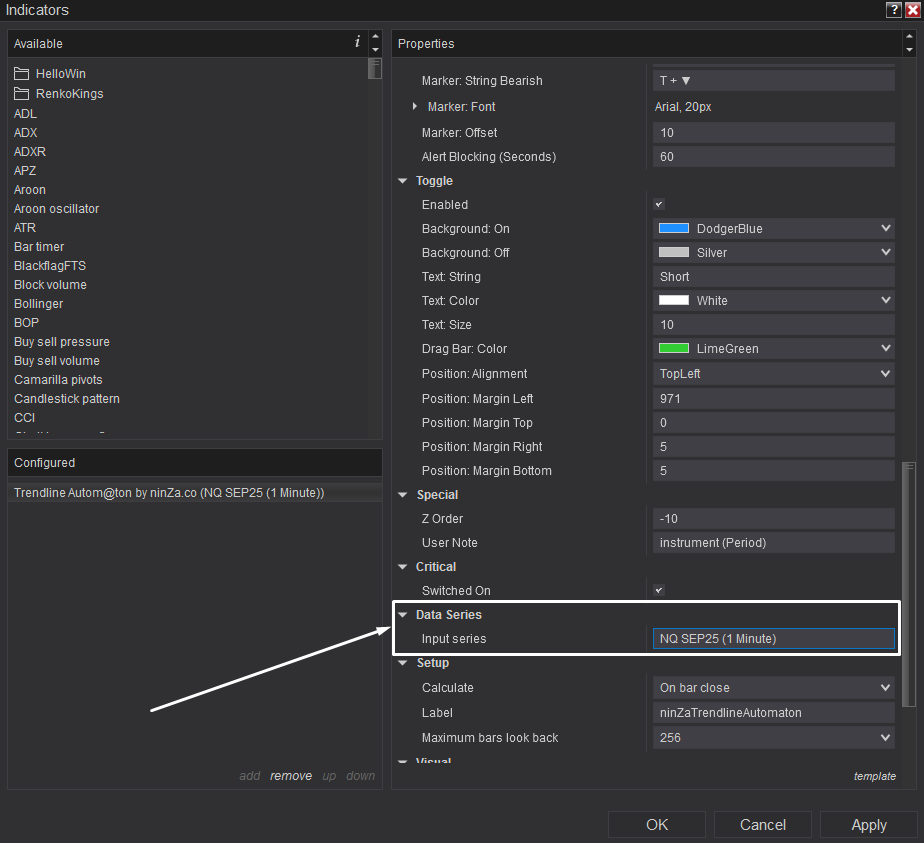
Step 2: Change the input setting to match the timeframe you just added to the data series.
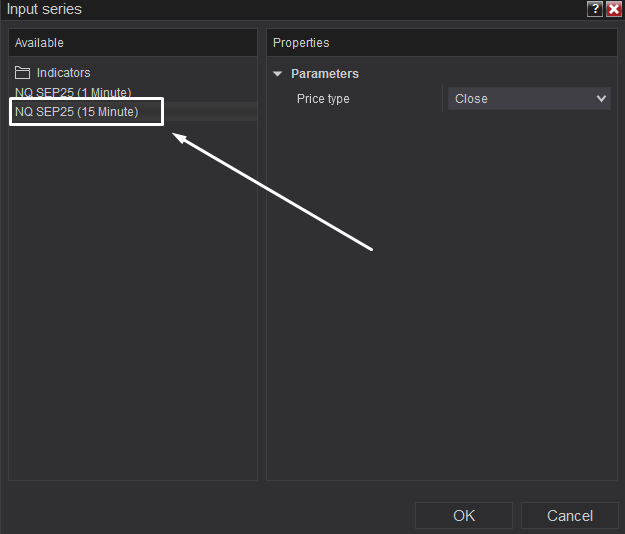
Step 3: Adjust the panel setting so that the trendlines drawn on the higher timeframe can be displayed on the lower timeframe where you plan to trade.
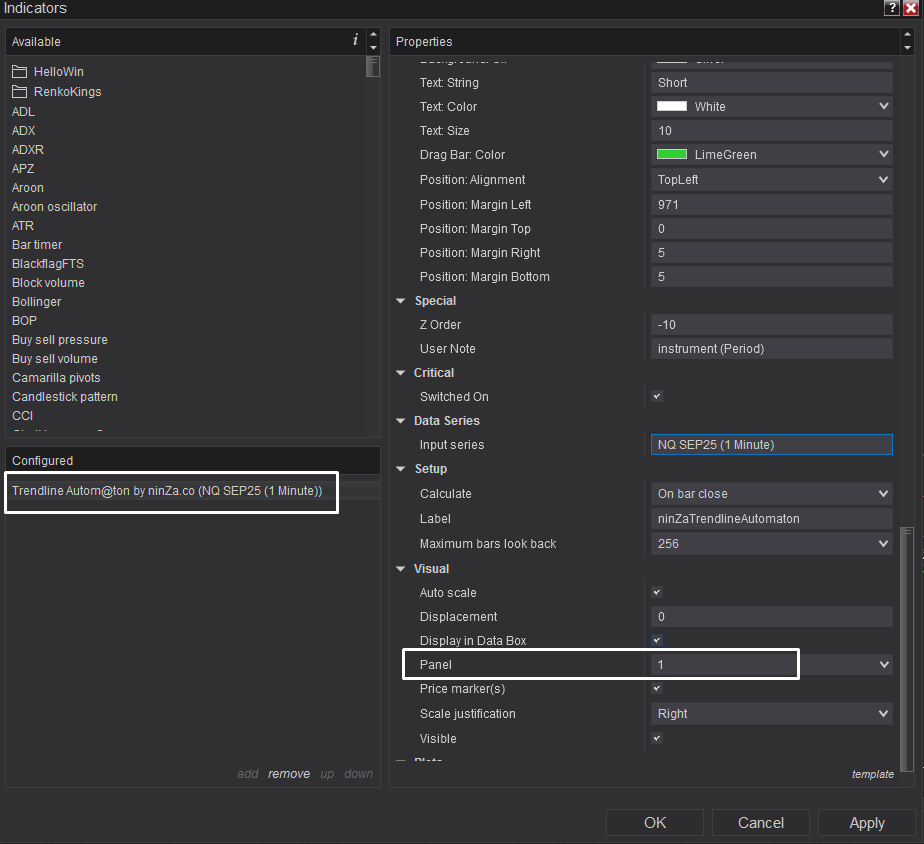
Step-by-Step: How to Use Trendline Autom@ton Effectively
Step 1: Add 3 instances of the indicator to your chart
→ One for each trendline period (Short, Medium & Long)
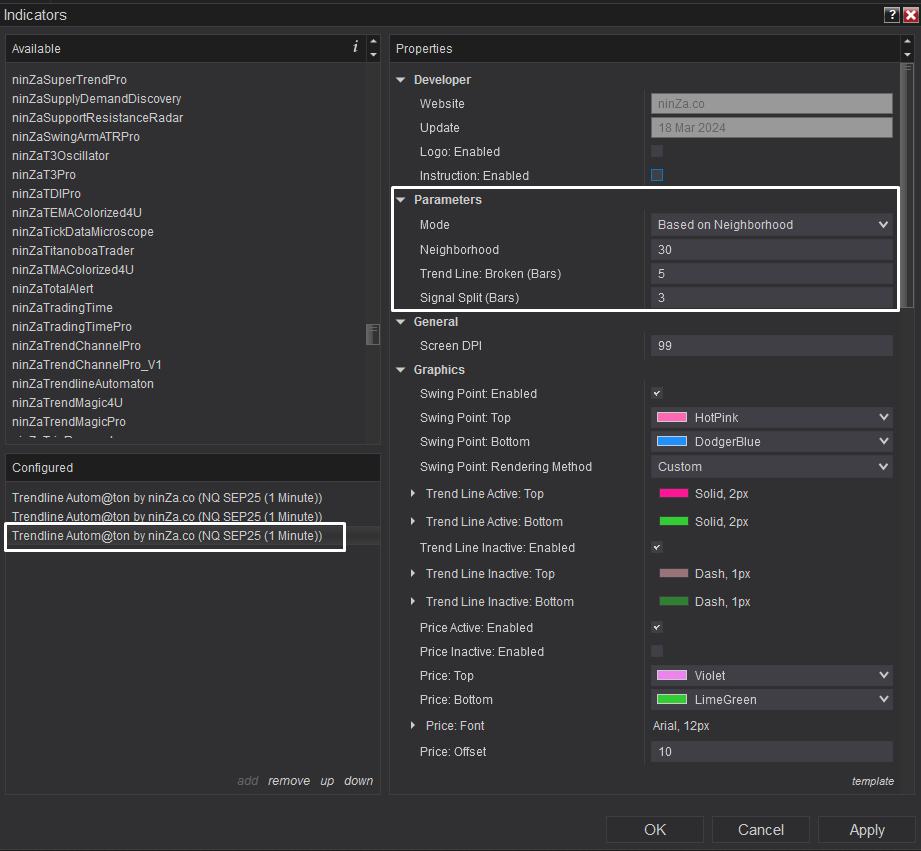
Step 2: Configure each instance with different settings
→ Adjust the parameters to suit short, medium, and long trendlines
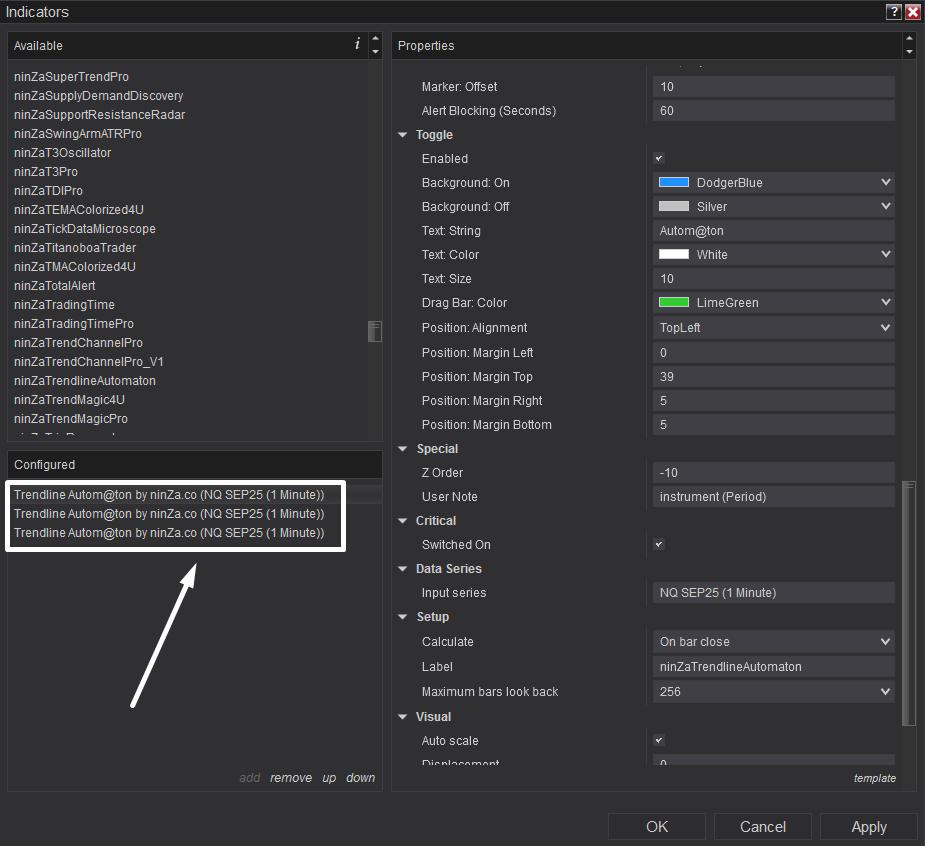
Setting for Short trendline:
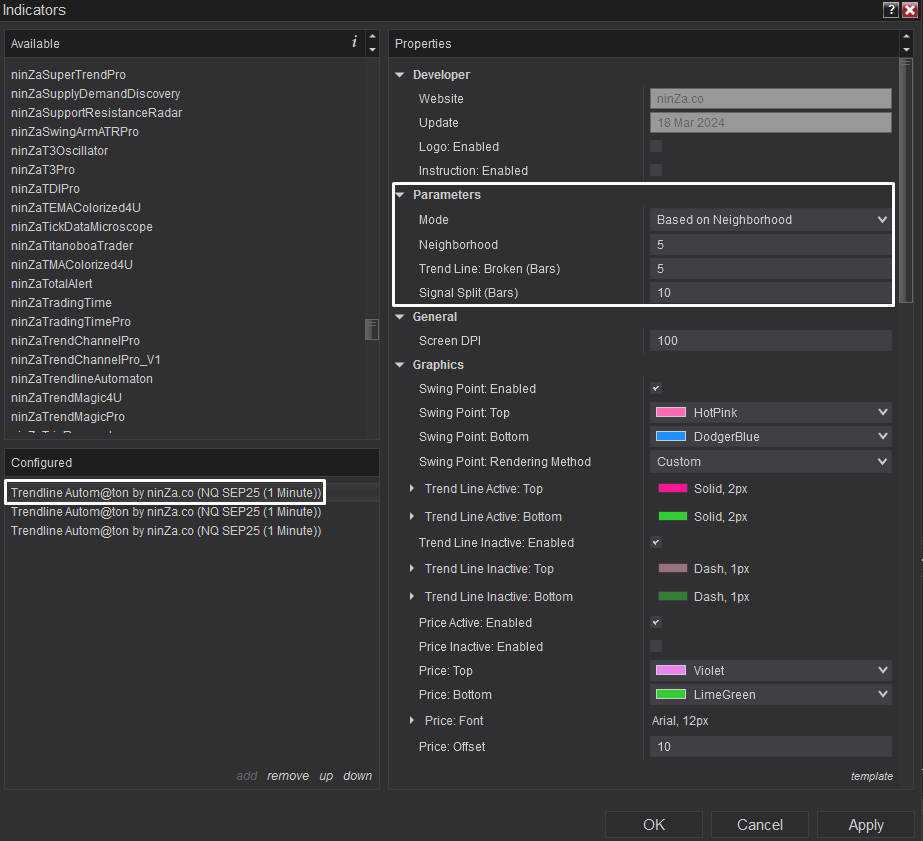
Setting for Medium trendline:
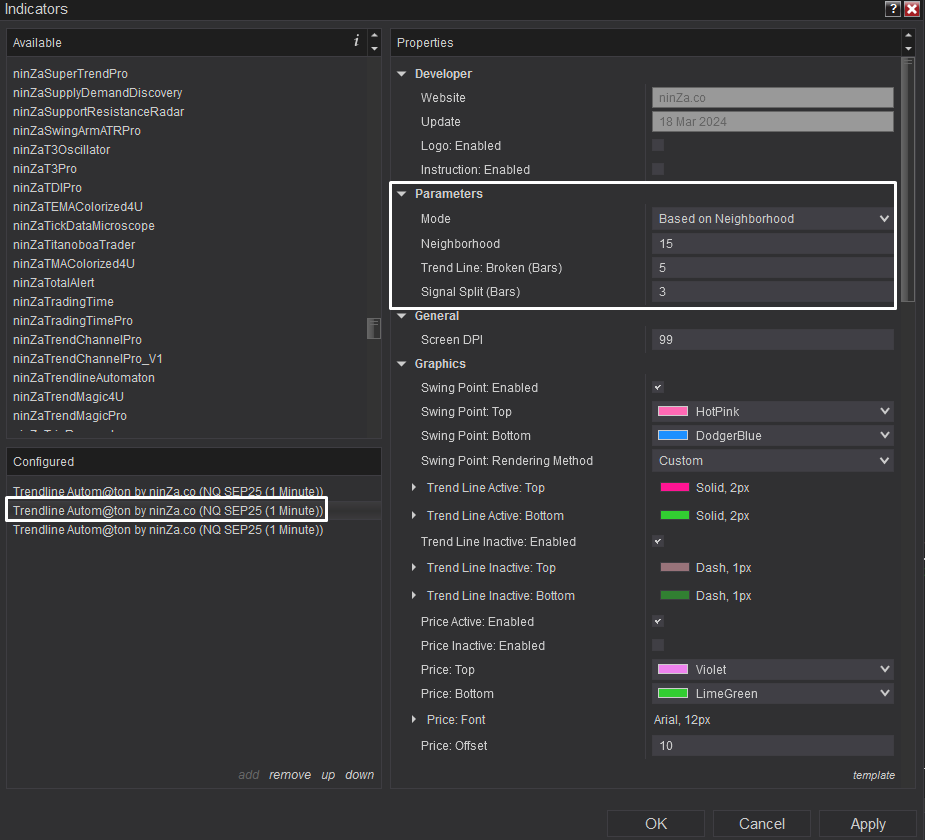
Setting for Long trendline:
Step 3: Rename for each
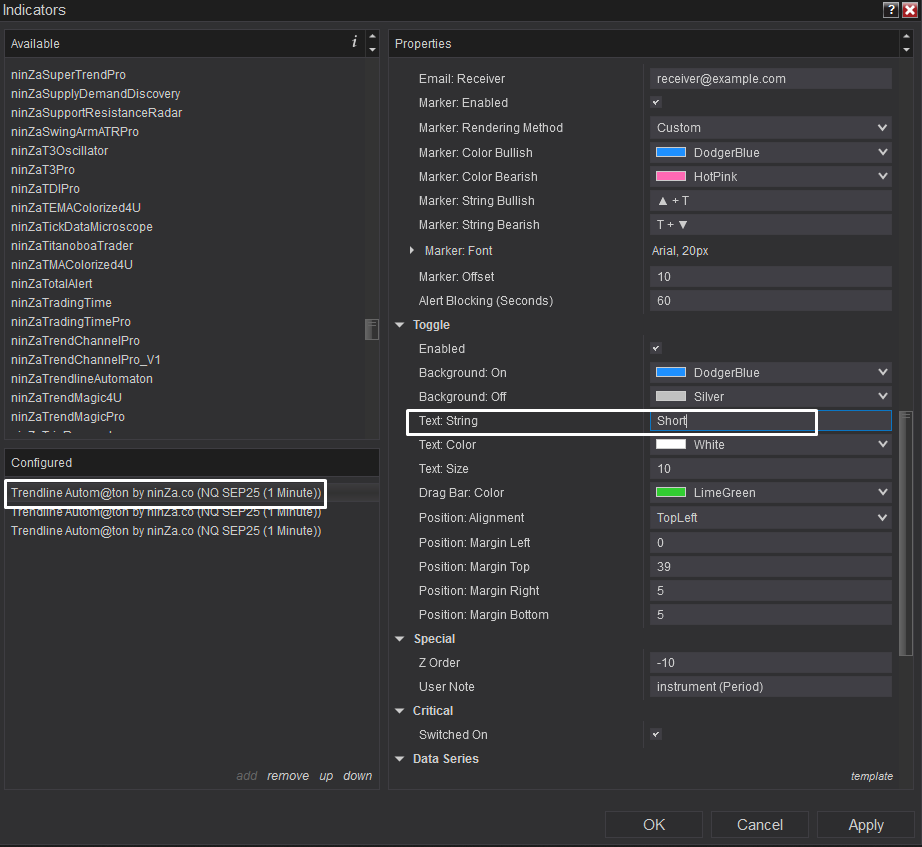
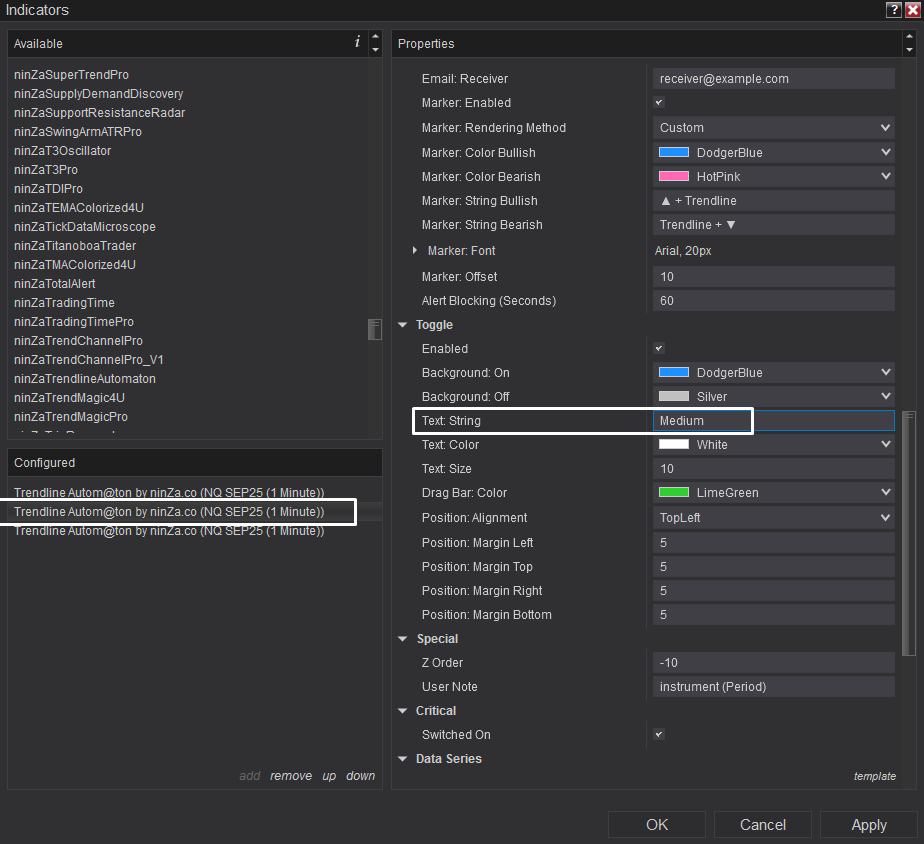
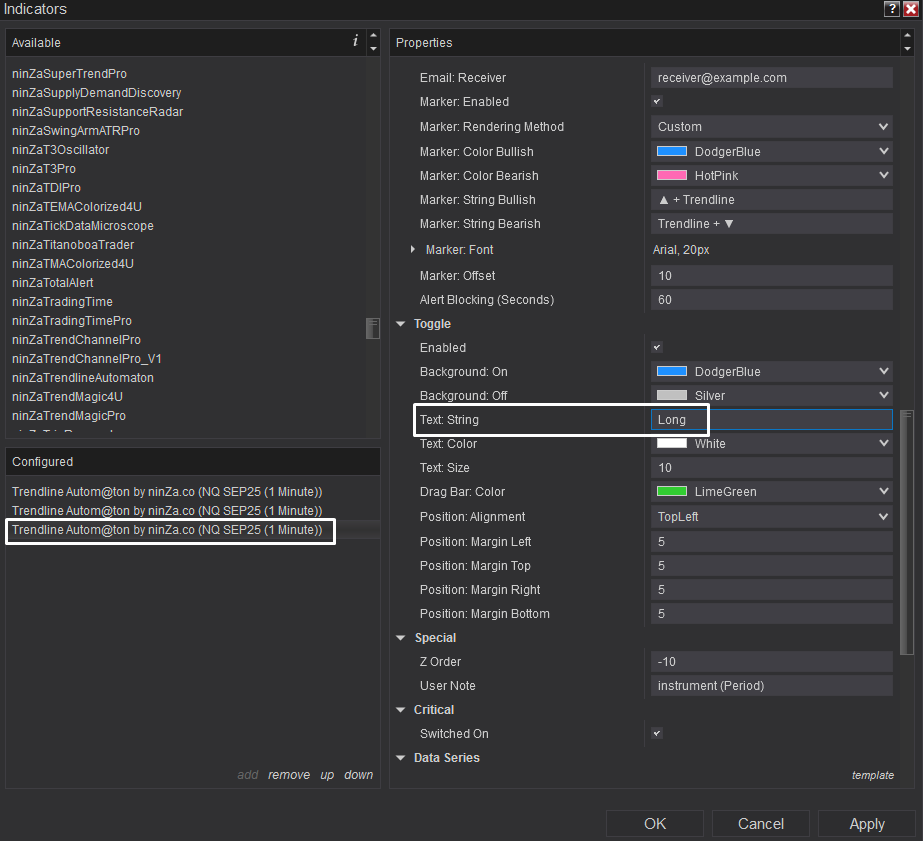
Step 4: Toggle visibility based on your strategy
→ For scalping, focus on short-term lines
→ For swing trades, combine medium and long-term trendlines for confluence

If you're interested in the Autom@ton trendline, you can check it out via the link below. Thanks a lot!
Trendline Autom@ton: https://ninza.co/product/trendline-automaton