Swing Trading and Day Trading are trading styles designed for traders who observe the market carefully and only enter trades with high-confidence setups. These traders don’t focus on quantity, but on quality - where the potential reward significantly outweighs the risk.
So, what elements are needed to execute a high-probability, high-reward trade?
In this context, we’ll focus purely on market behavior and structure - without mentioning indicators.
1. Identify the Market Structure
Understanding market structure helps you know what phase the price is currently in — trending up, trending down, or consolidating.
If in an uptrend, you can look to enter on pullbacks.
If in a downtrend, you can wait for bounce entries or breakouts.
If counter-trading the trend, you’ll need stronger confirmation, such as shift in buying/selling pressure or structure breaks.
In short, knowing the market structure helps you determine whether to enter, which direction to trade, and where the optimal entry zones are - rather than trading blindly.
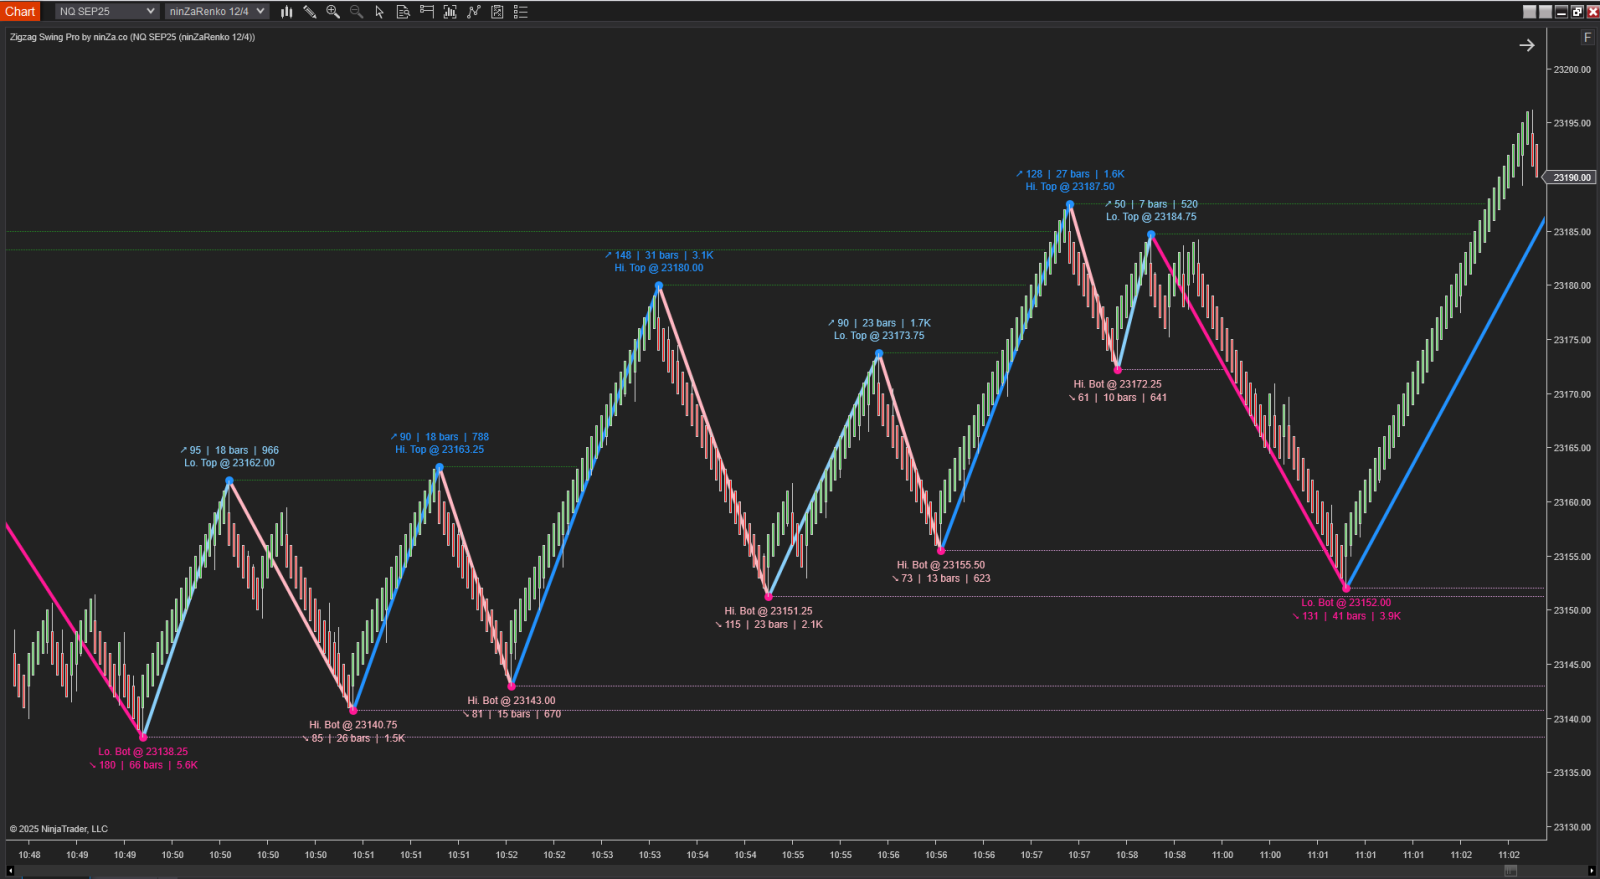
2. Identify Key Support/Resistance Zones According to Structure
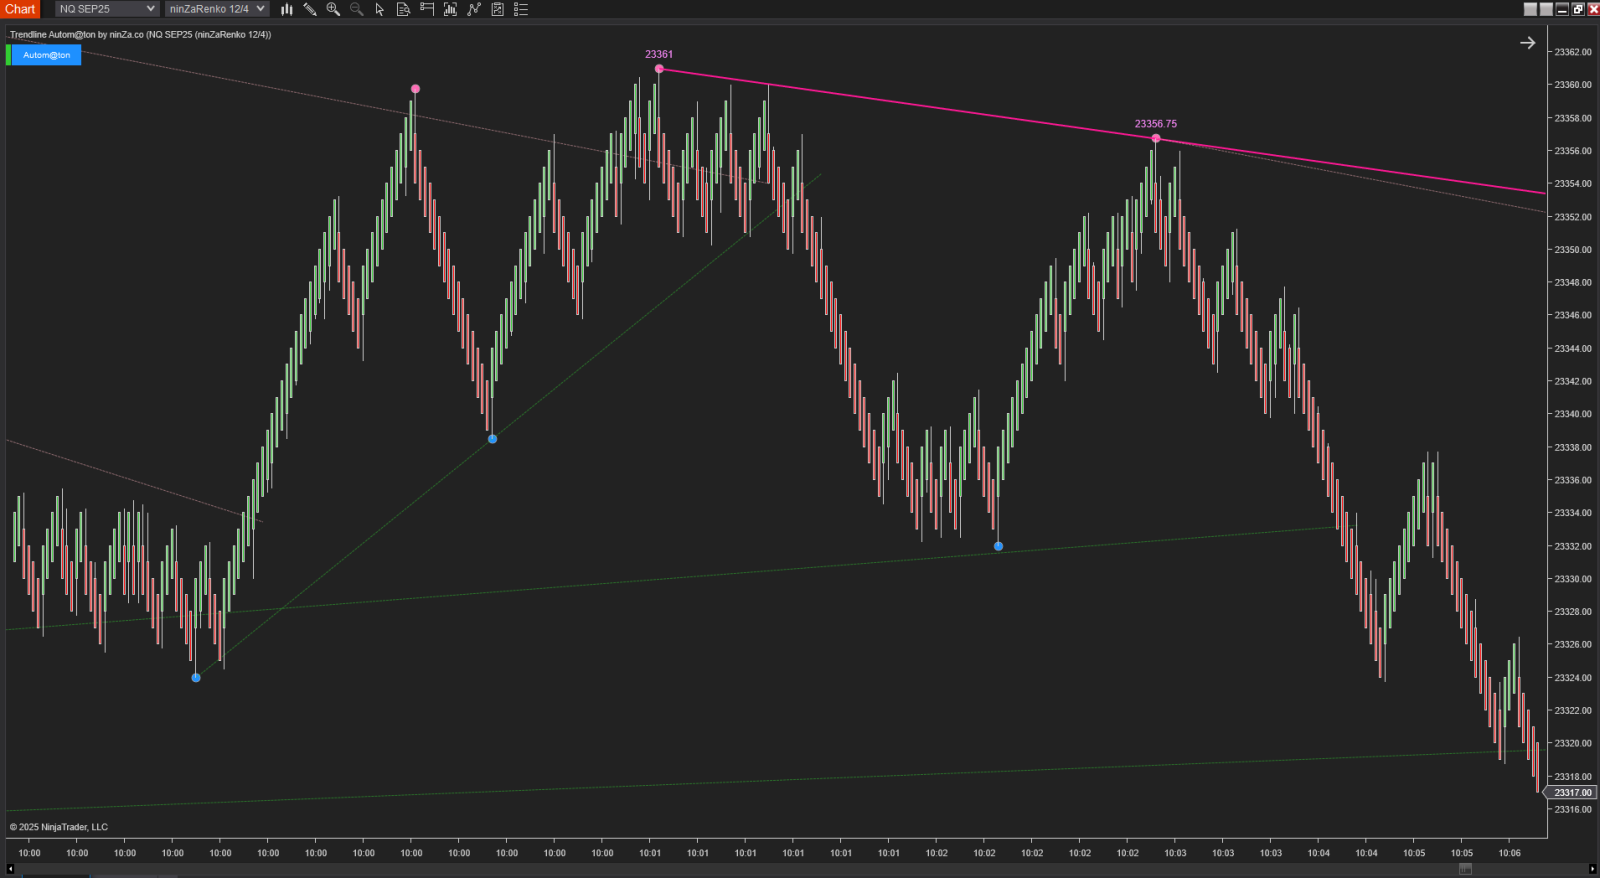
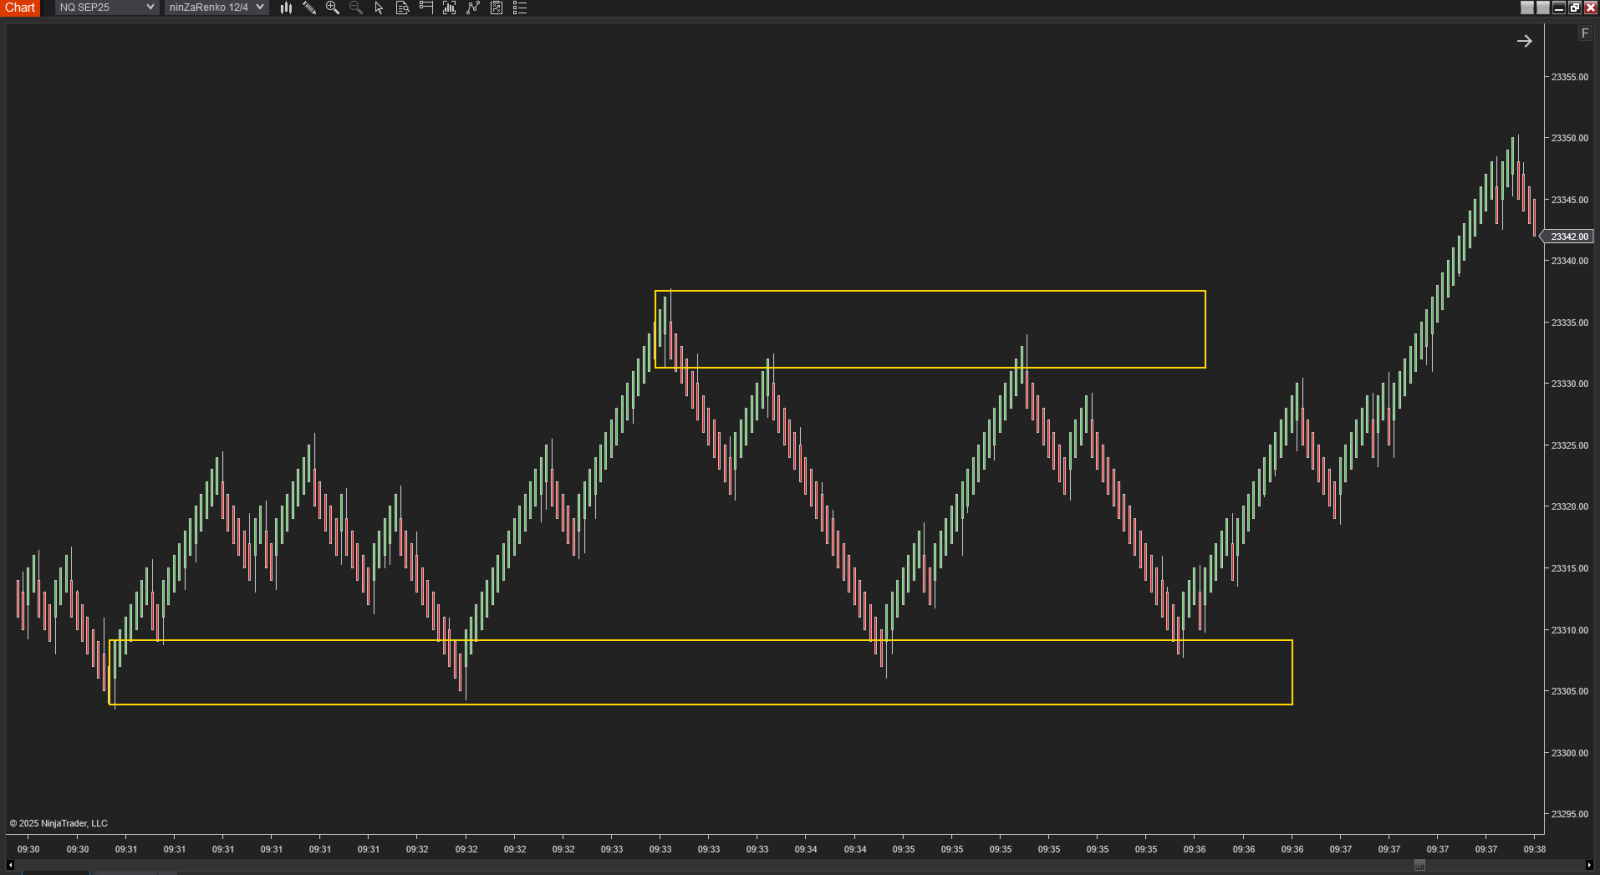
Support and resistance zones may include:
Trendlines (ascending or descending)
Significant swing highs/lows
Imbalance zones (areas where price moved too fast and may return to retest)
These levels act as decision zones where price is likely to react, reverse, or break through — offering valuable entry setups.
3. Evaluate Buying and Selling Pressure to Add Confidence
At key S/R zones, observe:
These insights strengthen your conviction in whether price is likely to hold or break a level. Volume-based analysis or price behavior can reveal this imbalance of power.
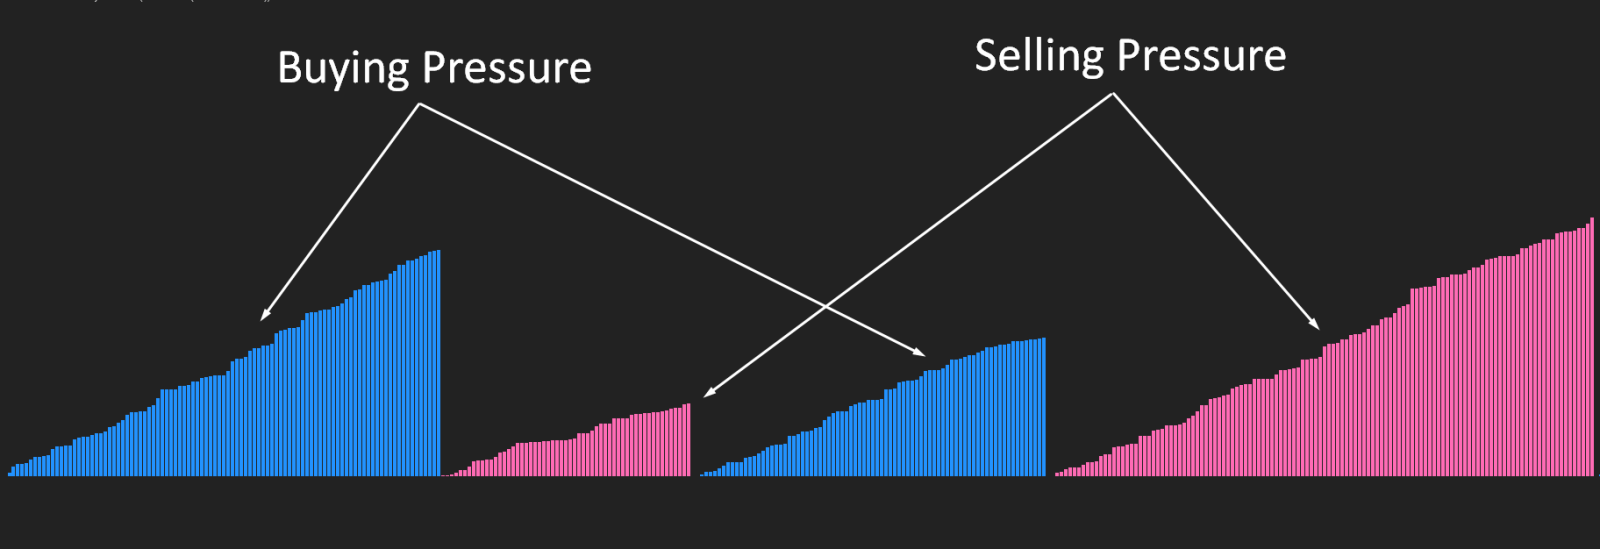
4. Enter the Trade When Price Reacts at S/R, Confirmed by Pressure
Don’t rush in. Wait until:
Price touches or retests a key level.
Buying/selling pressure confirms the setup (e.g., weak selling at support or rising demand at breakout zones).
This gives you a precise entry and allows you to place a tight stop-loss, maximizing your Risk:Reward Ratio.
5. Tip: Use Renko Charts to See Structure and Price Direction Clearly
Renko charts filter out time-based noise and focus solely on price movement, making it easier to spot:
Clear market structure
Trend direction
Entry zones
Example 1 – Trend Continuation Trade
1. Retest & Breakout
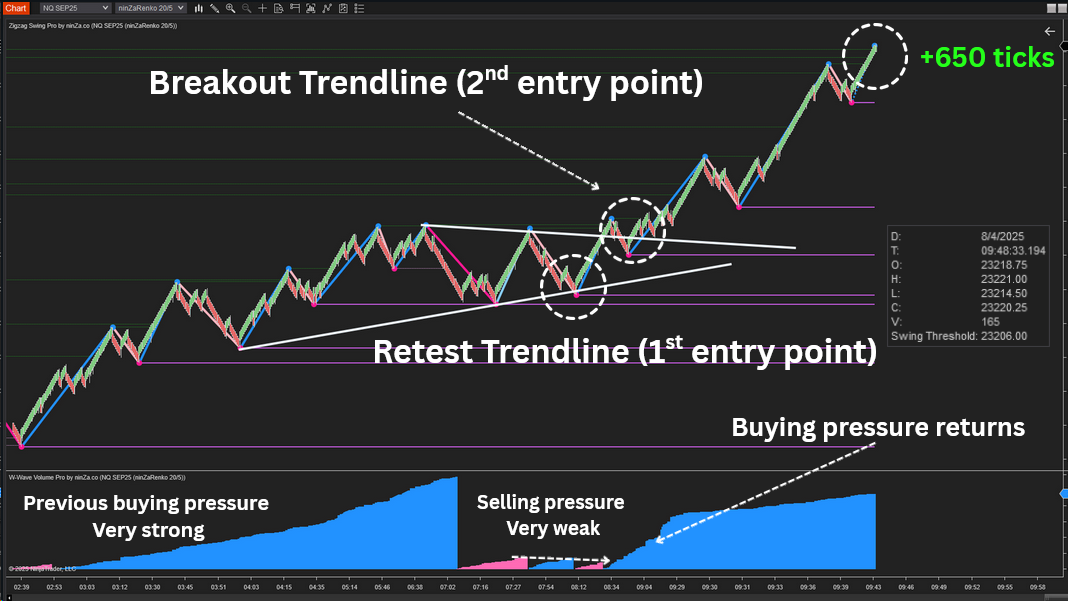
After a strong bullish rally with very strong previous buying pressure, the market started pulling back.
Selling pressure during the pullback remained very weak, signaling that sellers lacked control.
Price formed an ascending trendline and retested it → first entry point, supported by weak selling pressure and technical structure.
Later, price broke out of a resistance trendline → second entry point, right as buying pressure returned strongly.
The market rallied and reached +650 ticks profit.
2. Trend Reversal Trade
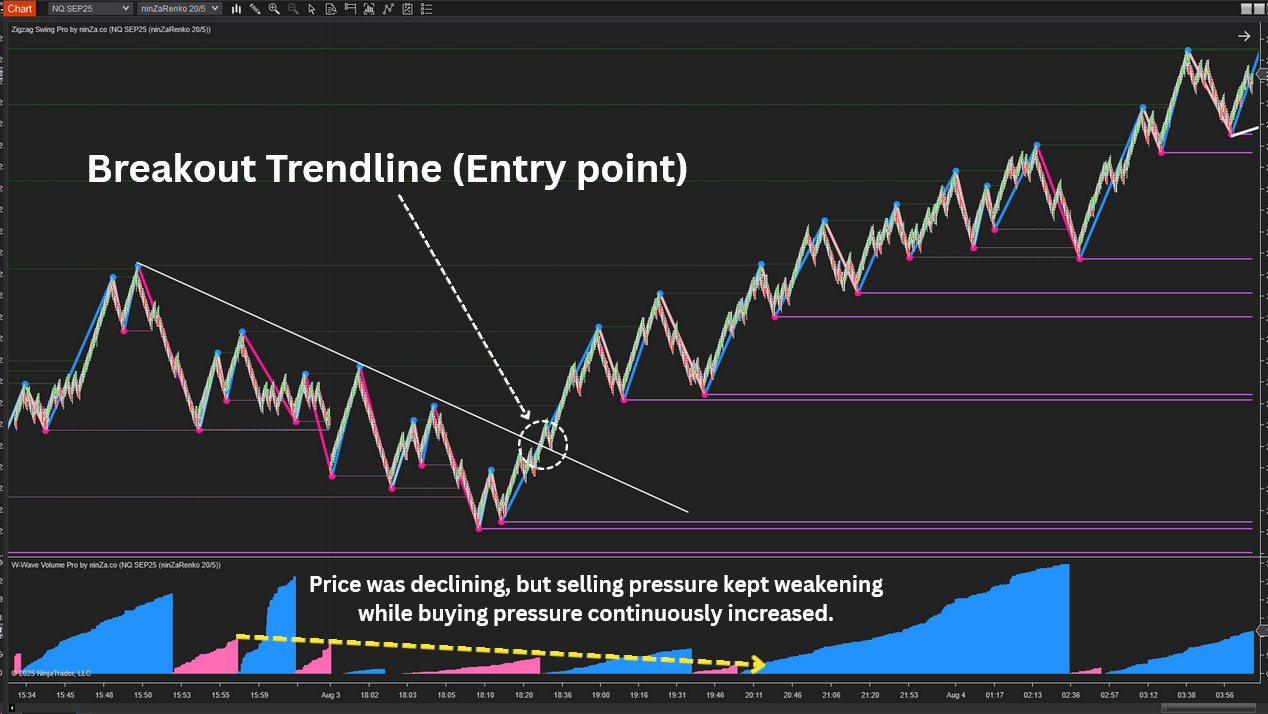
- Price was declining, but selling pressure kept weakening, while buying pressure gradually increased.
- Price then broke the descending trendline, signaling a potential reversal.
- Entry occurred when price pulled back to retest the broken trendline and bounced up.
- W-Wave Volume also showed a rise in buying pressure, confirming the bullish reversal.
If you enjoy trades with high reward potential, you might want to check out the
Deliberate AnaCute Trading: https://ninza.co/product/deliberate-anacute-trading
When trading based on price action and market structure, these setups often feel incredibly satisfying - not just because of the profit, but because everything lines up so clearly: structure, pressure, and timing.
They’re the kind of trades that remind you why you love watching the market.